EQNR Elliott Wave forecast signals strong long term bullish potential

Equinor ASA (NYSE: EQNR) has transformed from a prolonged period of underperformance into one of the energy sector’s strongest long-term recovery stories. After bottoming in March 2020, EQNR has rallied to fresh all-time highs. This is supported by a renewed strength across global energy markets.
The key question for investors is whether this breakout is the beginning of an even larger advance. Elliott Wave analysis suggests the answer may be yes.
About Equinor (NYSE: EQNR)
Equinor ASA is a Norway-based global energy company and one of the world’s leading offshore oil and gas producers. Alongside its traditional energy business, the company has expanded aggressively into offshore wind, carbon capture, and other low-carbon initiatives. This has positioned EQNR as a diversified energy stock for long-term investors.
EQNR Elliott Wave analysis – Weekly chart
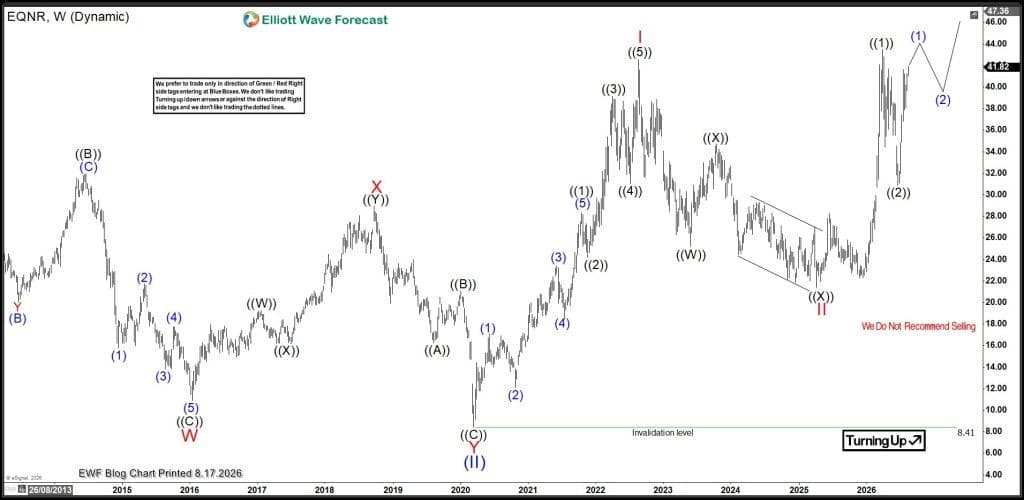
The weekly Elliott Wave chart reveals a compelling long-term bullish nest, a structure that often precedes extended upside acceleration. Since its historical low near $6, EQNR completed a five-wave impulse to finish Wave (I) before entering a deep three-wave corrective decline.
That correction lasted from May 2008 to March 2020, nearly 12 years, and erased more than 80% of the stock’s gains. The decline completed Wave (II), setting the stage for a new secular bull cycle.
From the March 2020 low, EQNR began Wave (III)—typically the strongest and longest wave in an Elliott Wave sequence. The first impulsive advance completed Wave I of (III). Afterwards, a 32-month double zigzag correction into April 2025, where Wave II of (III) found support.
With that correction complete, EQNR has resumed higher in Wave ((1)) of III, breaking to new all-time highs and confirming the larger bullish trend. Based on Fibonacci projections, the next major target for Wave III comes in around $68–76, with the potential for even higher levels as the trend matures.
The multiple nesting structure across higher degrees continues to favor buying pullbacks rather than selling rallies.
EQNR Elliott Wave analysis – Daily chart
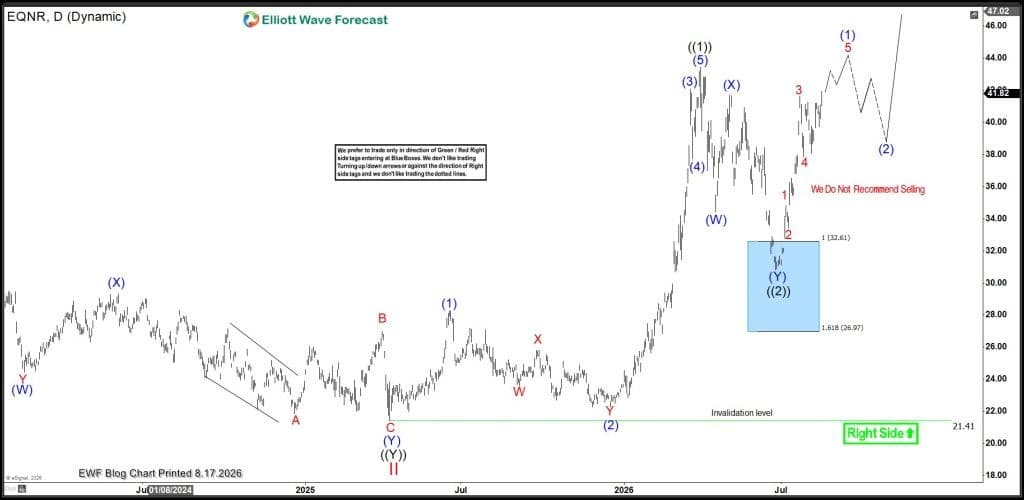
The daily chart highlights the internal structure of the current advance. Following the completion of Wave ((1)), EQNR entered Wave ((2)), which unfolded as another double zigzag correction into the Blue Box support zone at $32.61–26.97. That high-probability buying area produced the expected bullish reaction, and EQNR is now advancing in Wave (1) of ((3)).
If EQNR extends to new highs, Elliott Wave traders should avoid chasing strength and instead wait for the next Wave (2) pullback to develop in 3, 7, or 11 swings before looking for fresh buying opportunities.
Author

Elliott Wave Forecast Team
ElliottWave-Forecast.com

















