Elliott Wave view: Uranium Miners ETF (URA) at the crossroads – Rally or larger correction?

URA, the Global X Uranium ETF, offers investors exposure to companies engaged in uranium mining and nuclear energy production. It tracks the Solactive Global Uranium & Nuclear Components Index, making it a focused way to participate in the uranium sector and the broader nuclear energy theme.
In this analysis, we apply Elliott Wave principles to assess the ETF’s broader technical landscape. By mapping its higher‑degree cycles alongside the finer internal structures, we outline how uranium equities may evolve within the ongoing commodity supercycle. This approach not only situates URA within its historical framework but also highlights pivotal levels where renewed strength could emerge.
URA Elliott Wave chart monthly chart
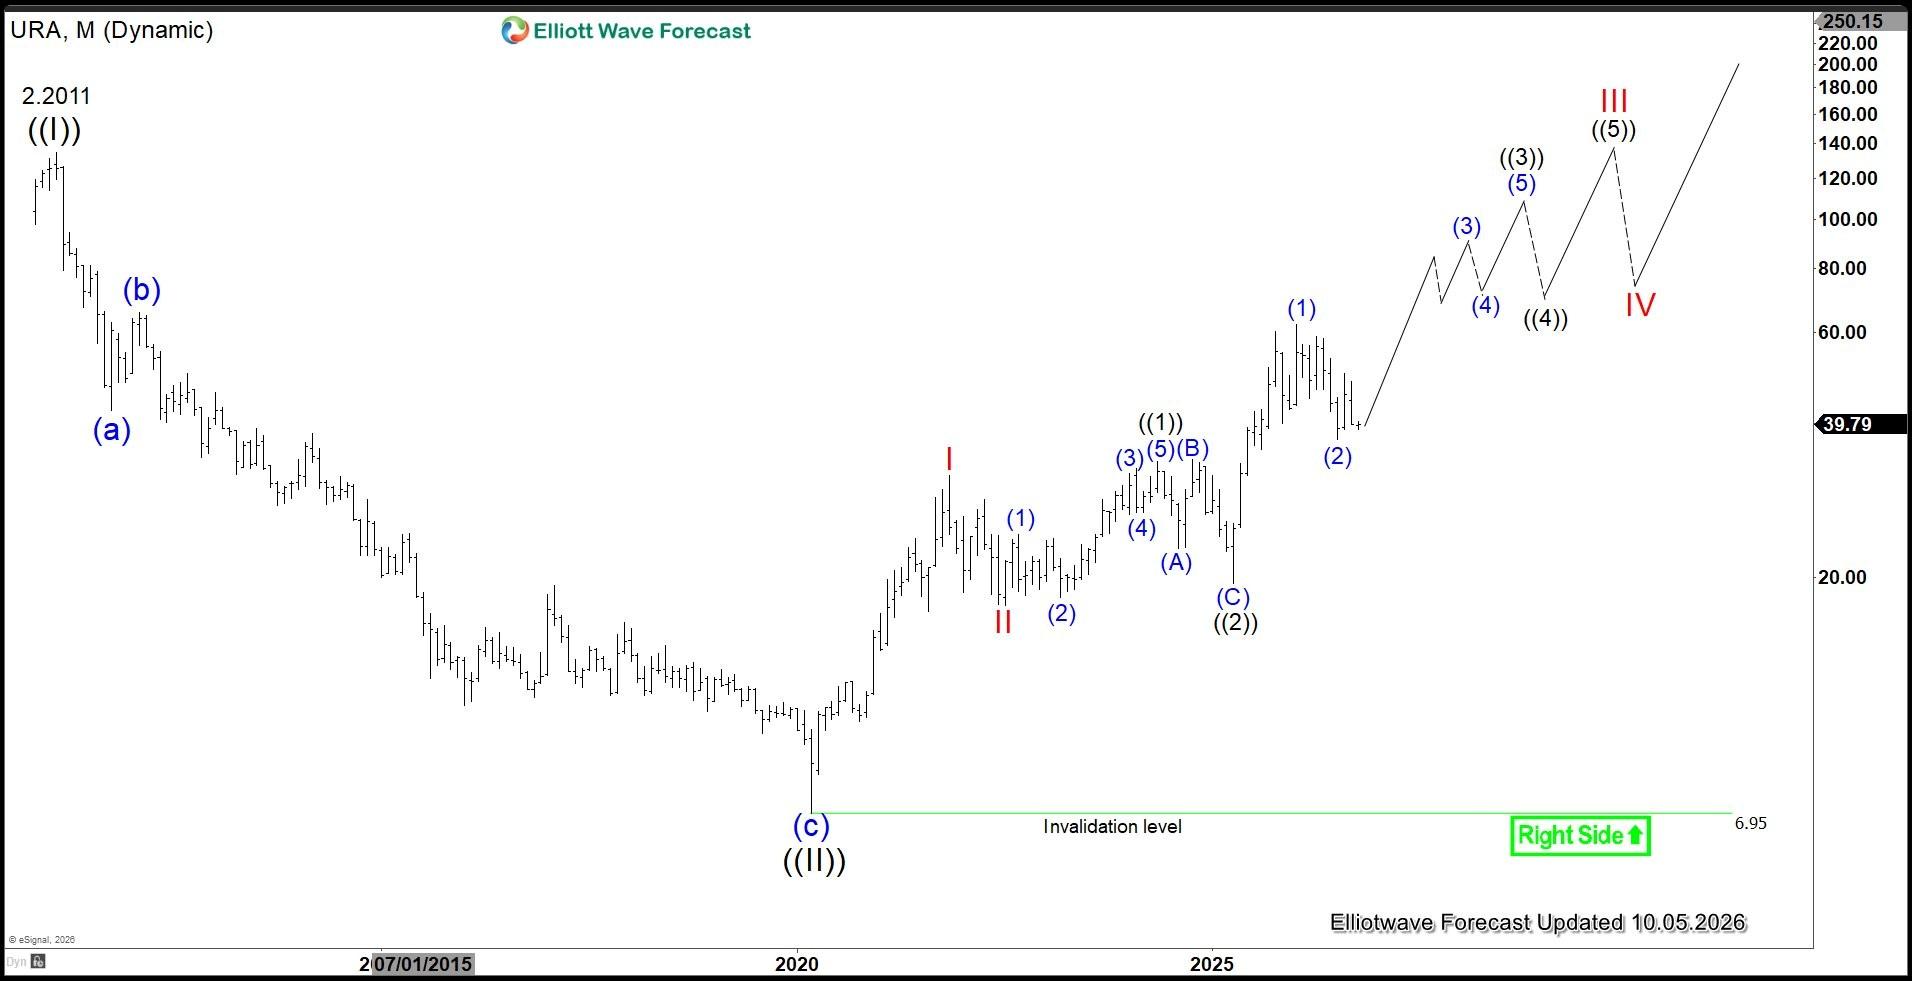
On the monthly Elliott Wave chart of the Uranium Miners ETF (URA), Grand Super Cycle wave ((II)) concluded at $6.95, marking a significant long‑term low. From this foundation, the ETF launched into a new bullish phase within wave ((III)), developing as a five‑wave impulse.
From the termination of wave ((II)), wave I advanced to $31.60 before a corrective decline in wave II carried prices down to $17.65. The subsequent rise unfolded as wave III, itself structured as an impulse: wave ((1)) peaked at $33.66, while wave ((2)) retraced to $19.50. The ETF then nested higher within wave ((3)), with wave (1) of ((3)) reaching $62.28 and the pullback in wave (2) of ((3)) potentially completing at $37.18.
Provided price action holds above $6.95, corrective declines are anticipated to draw buyers in three‑ or seven‑swing sequences, reinforcing the broader bullish trajectory and paving the way for continued upside in line with the larger cycle.
URA daily Elliott Wave chart
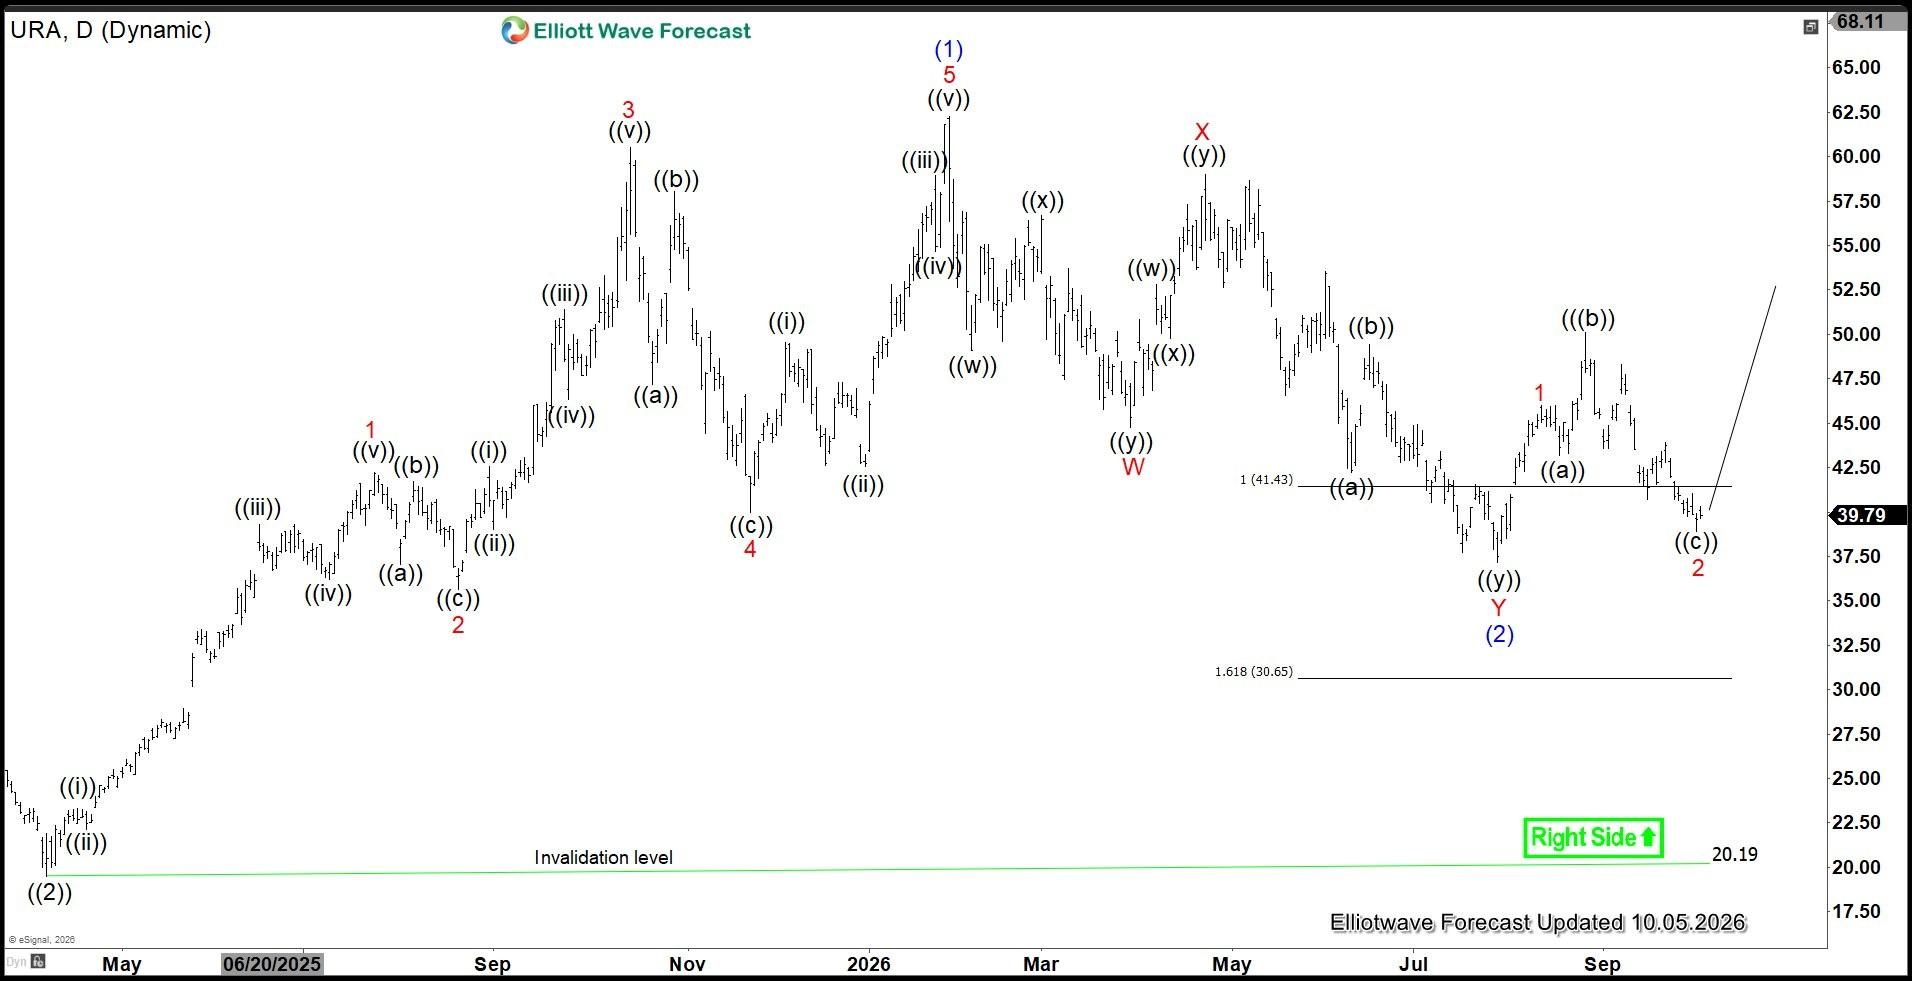
The daily chart of the Uranium ETF shows that the advance from the April 7, 2025 wave ((2)) low culminated in wave (1) at $62.28, unfolding as a five‑wave diagonal. The ensuing correction in wave (2) has been developing as a seven‑swing pattern, more specifically a double three.
From the wave (1) peak, wave W declined to $44.76, followed by a rebound in wave X that carried prices to $59.97. Wave Y then extended into the 100%–161.8% Fibonacci zone between $30.65 and $41.43, with a possible completion of wave (2) near $37.18. Yet, confirmation requires a break above the prior wave (1) high to eliminate the risk of a larger double correction.
Although the ETF managed to rally, it has since turned lower again, raising the possibility of retesting or breaching the $37.18 low. Holding that level would support another upward push, while a decisive break beneath it would signal that a broader corrective sequence is unfolding.
Author

Elliott Wave Forecast Team
ElliottWave-Forecast.com
















