|

Elliott Wave view: Microsoft (MSFT) shows incomplete impulsive structure [Video]

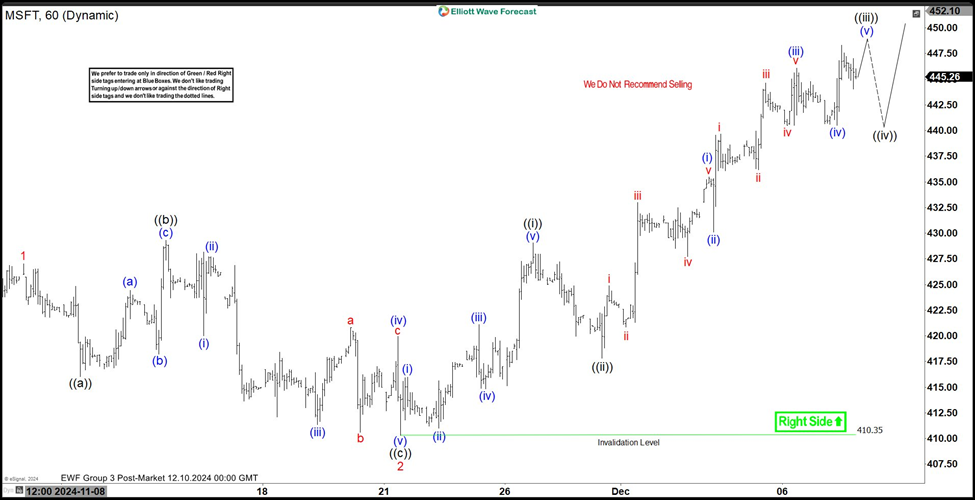
Short Term Elliott Wave in Microsoft (MSFT) suggests rally from 11.4.2024 low is unfolding as a 5 waves impulse. Up from 11.4.2024 low, wave 1 ended at 427 and pullback in wave 2 ended at 410.35 as the 1 hour chart below shows. Internal subdivision of wave 2 unfolded as an expanded flat Elliott Wave structure. Down from wave 1, wave ((a)) ended at 416 and wave ((b)) ended at 429.32. Wave ((c)) lower ended at 410.35 which completed wave 2 in higher degree. The stock has turned higher in wave 3.

Microsoft (MSFT) 60 minutes Elliott Wave chart
Chart

Internal subdivision of wave 3 is unfolding as a 5 waves impulsive structure. Up from wave 2, wave (i) ended at 415.94 and wave (ii) ended at 411. Wave (iii) higher ended at 421.08 and pullback in wave (iv) ended at 414.85. Wave (v) higher ended at 429.04 which completed wave ((i)) in higher degree. Pullback in wave ((ii)) ended at 417.80 and the stock has resumed higher again. Up from wave ((ii)), wave (i) ended at 435.47 and wave (ii) ended at 430.12. Wave (iii) higher ended at 446.1 and pullback in wave (iv) ended at 440.50. Expect the stock to extend higher in wave (v) to complete wave ((iii)). Afterwards, it should pullback in wave ((iv)) to correct cycle from 11.29.2024 low in 3, 7, or 11 swing before it resumes higher again.

MSFT Elliott Wave [Video]

Author

Elliott Wave Forecast Team

Elliott Wave Forecast Team

ElliottWave-Forecast.com

More from Elliott Wave Forecast Team
Share:

Editor's Picks

AUD/USD meets fresh supply and tests 0.7100 amid weak Australian PMIs

AUD/USD has come under fresh selling pressure and is testing 0.7100 in the Asian session on Wednesday. Australia's flash PMIs showed manufacturing slipped into contraction and services expanding slowly for a second straight month, renewing the pair's downside. Furthermore, a bullish US Dollar acts as a headwind for the pair as traders keenly await the crucial Trump-Xi summit on Thursday. Meanwhile, markets shrug off US-Iran indirect talks.

USD/JPY stands firm near mid-157.00s, close to two-week high

USD/JPY hovers around mid-157.00s in the Asian session on Wednesday, near two-week highs touched last Friday as the BoJ's dovish rate hike continues to undermine the Japanese Yen. Meanwhile, the US Dollar remains firm amid the Fed's hawkish stance, adding support to the pair, though JPY intervention fears cap further gains. Markets pay little heed to the completion of the round of US-Iran indirect talks ahead of Trump-Xi meeting.

Gold falls as strong US PMI data gives Fed room to raise rates again

Gold (XAU/USD) trades on the back foot on Wednesday as expectations of further Federal Reserve (Fed) interest rate hikes lift the US Dollar (USD) and weigh on the non-yielding metal.

Crypto Today: Bitcoin and Ethereum consolidate gains as XRP extends breakout
Bitcoin (BTC) is moderating on Wednesday, trading near $86,000 as the crypto market broadly consolidates. Ethereum (ETH) mirrors BTC’s stable outlook, holding above $2,700. Ripple (XRP), meanwhile, edges higher for the sixth consecutive day, currently sitting above $1.61 as bulls tighten their grip.
Oil rebounds above $90: Why is the Canadian Dollar still falling?
USD/CAD extends its advance on Wednesday and trades around 1.4090 at the time of writing, up 0.21% on the day. The pair remains close to its recent highs, supported by a firm US Dollar (USD), while the Canadian Dollar (CAD) struggles to recover losses from the recent decline in Oil prices. Oil dynamics, however, are becoming less negative for the Loonie.
BoJ Recap: Not as hawkish as expected

The Bank of Japan (BoJ) raised its short-term interest-rate target to 1.25% from 1.00% in a 7-2 vote, marking another step in the normalisation of monetary policy and widely matching what everyone has been expecting for weeks.