|

Elliott Wave view: Meta zigzag pullback nears key $522-545 support range [Video]

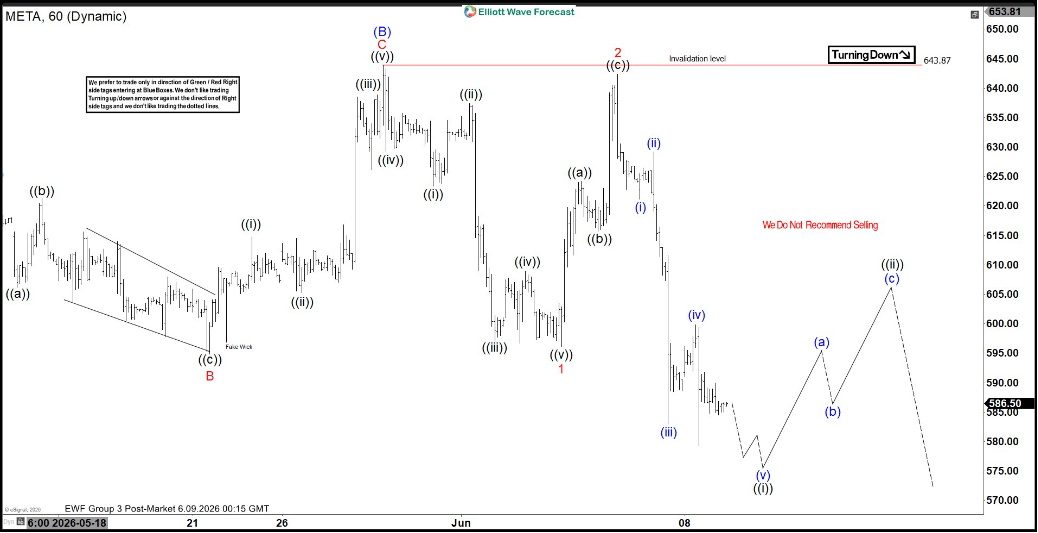
The short‑term rally in Meta from the March 27, 2026 low shows impulsive momentum, favoring continued upside while price holds above this pivot. Within Elliott Wave analysis, this advance ended as wave ((1)). The stock is now retracing in wave ((2)), correcting the prior rally. The internal subdivision of this pullback unfolds as a zigzag structure, which is typical in second waves.

From the April 18 high, wave (A) finished at $592.6, followed by a rally in wave (B) that reached $643.87. The decline has resumed in wave (C), which develops as a five‑wave diagonal. The measured target lies between $522 and $545, based on the 100%–161.8% Fibonacci extension of wave (A).

Breaking down wave (C), wave 1 ended at $596.14, while wave 2 rallied to $642.4. The subsequent wave 3 decline reached $579.22. A wave 4 rally is anticipated but should fail in either three or seven swings, setting the stage for further downside.

Near term, as long as the pivot at $643.87 remains intact, rallies are expected to fail in corrective sequences. This outlook supports continued weakness toward the projected support zone, where buyers may attempt to stabilize price action.

META Elliott Wave chart
META Elliott Wave [Video]
Youtube preview

Author

Elliott Wave Forecast Team

Elliott Wave Forecast Team

ElliottWave-Forecast.com

More from Elliott Wave Forecast Team
Share:

Editor's Picks

AUD/USD: Next on the upside is 0.7000

AUD/USD leaves behind Monday’s downtick and trades with marked gains, approaching the critical 0.7000 yardstick ahead of the opening bell in Asia on Wednesday. The pair’s solid performance follows the Greenback’s fresh downward trend amid cooling geopolitical tensions and caution ahead of the US CPI data.

USD/JPY extends retreat below 158.50 as intervention risks loom

USD/JPY is dropping below 158.50 in the Asian session on Tuesday, snapping a two-day winning streak and pulling back from an over two-week top touched the previous day, despite Japan's soft PPI inflation print. Bulls turn cautious amid speculation that authorities will step in to prop up the Japanese Yen, which, in turn, weighs on the pair.

Gold: Bears struggle to breach below $4,150

Gold now gives away its initial gains and resumes its decline, revisiting the $4,160 region per troy ounce on Tuesday. The precious metal’s pullback comes despite the fresh downward trend in the Greenback in combination with a mixed performance of US Treasury yields across the board and easing tensions on the geopolitical front.

HYPE falls to $80 as ETF outflows and flat volume weigh on Hyperliquid
Hyperliquid (HYPE) declines 4% on Tuesday, briefly touching $80 as perpetual volumes stay flat and institutional interest decreases. Perpetual volume on the platform saw a modest increase last week from $41.5 billion to $42.5 billion. The metric matters because 99% of fees Hyperliquid captures from trading volume flow toward token buybacks.
S&P 500 earnings just hit a record. The AI data centre bill hasn't landed yet
S&P 500 companies are on track for a third straight quarter of earnings growth above 25%, according to FactSet. Their profit margin hit 17% in the April-June quarter, the highest in FactSet data going back to 2009. The cash behind those earnings has been shrinking for two years, and almost all of the shrinkage is in the handful of companies building data centres for artificial intelligence (AI).
Has Bitcoin really escaped the macro forces it was built to fight?
Over 17 years ago, Satoshi Nakamoto designed Bitcoin (BTC) on the back of a global financial crisis as an alternative to the global monetary system outside the control of central banks, governments and traditional intermediaries. This raises a key question: has Bitcoin really become independent of the macroeconomic forces it was built to challenge?