GBP/JPY Price Forecast: Bulls challenge 210.00 as breakout looms
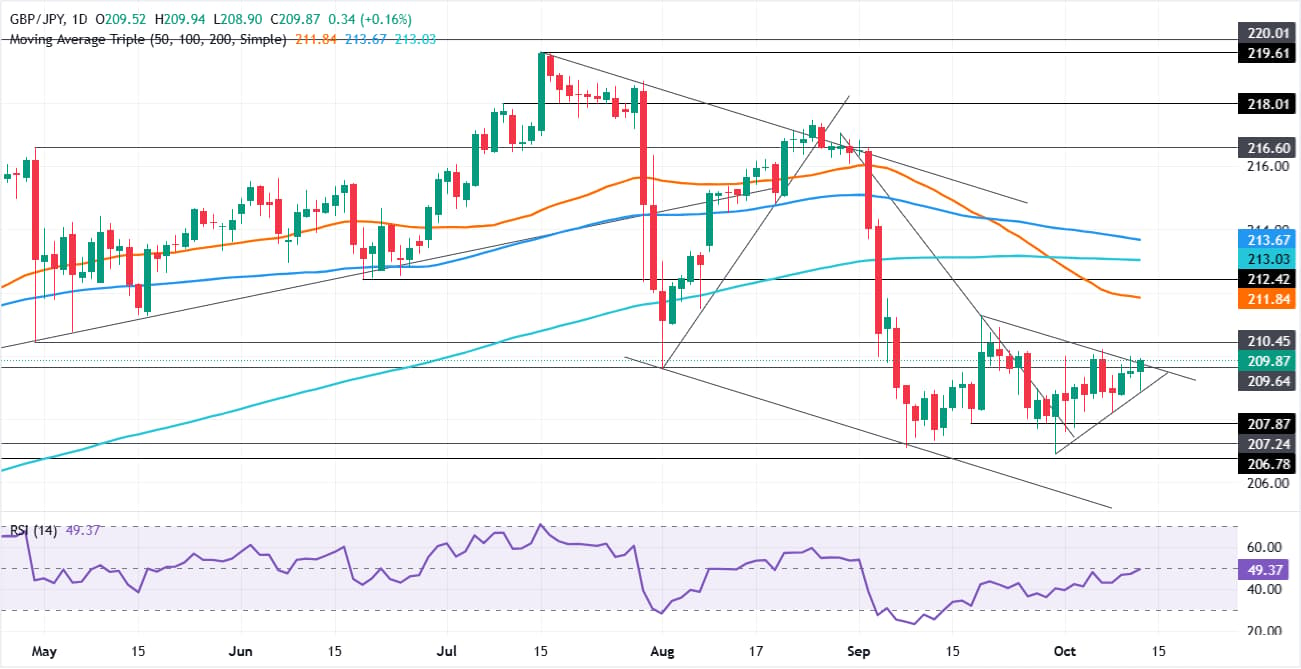
- GBP/JPY extends gains as buyers challenge descending resistance near 210.00.
- RSI approaches the neutral level, signaling improving momentum despite broader consolidation.
- Break above 210.00 exposes 211.28 and 50-day SMA at 211.84.

The GBP/JPY pair extends its modest gains for two straight days this week, up 0.16% on Tuesday, as the cross-pair continues to consolidate near the 210.00 figure with no clear bias, while the Relative Strength Index (RSI) drifts higher towards its 50-neutral level, an indication that buyers are stepping in.
GBP/JPY Price Forecast: Technical outlook
As of writing, a downslope resistance trendline near 209.80-210.00 is being tested by buyers, who were quickly rejected on Monday after hitting a weekly high of 209.99.
Worth noting that the day’s price action shows buying pressure building after GBP/JPY reached the day's low below 209.00, respecting a support trendline tested three times, indicating further upside.
A decisive breakout above 210.00 puts into play the September 18 cycle high of 211.28. Further gains are seen beyond that area, with the 50-day SMA seen as a key supply zone at 211.84.
Conversely, for a bearish continuation, GBP/JPY must drop below 209.00 and clear the support trendline, which caps losses, with the next support at 206.89, the September 30 low.
GBP/JPY Price Forecast: Technical outlook
Japanese Yen Price Today
The table below shows the percentage change of Japanese Yen (JPY) against listed major currencies today. Japanese Yen was the strongest against the US Dollar.
| USD | EUR | GBP | JPY | CAD | AUD | NZD | CHF | |
|---|---|---|---|---|---|---|---|---|
| USD | -0.38% | -0.34% | -0.17% | -0.45% | -0.34% | -0.46% | -0.26% | |
| EUR | 0.38% | 0.03% | 0.21% | -0.05% | 0.03% | -0.07% | 0.13% | |
| GBP | 0.34% | -0.03% | 0.15% | -0.13% | -0.01% | -0.14% | 0.10% | |
| JPY | 0.17% | -0.21% | -0.15% | -0.27% | -0.16% | -0.28% | -0.06% | |
| CAD | 0.45% | 0.05% | 0.13% | 0.27% | 0.11% | -0.01% | 0.21% | |
| AUD | 0.34% | -0.03% | 0.01% | 0.16% | -0.11% | -0.12% | 0.09% | |
| NZD | 0.46% | 0.07% | 0.14% | 0.28% | 0.00% | 0.12% | 0.23% | |
| CHF | 0.26% | -0.13% | -0.10% | 0.06% | -0.21% | -0.09% | -0.23% |
The heat map shows percentage changes of major currencies against each other. The base currency is picked from the left column, while the quote currency is picked from the top row. For example, if you pick the Japanese Yen from the left column and move along the horizontal line to the US Dollar, the percentage change displayed in the box will represent JPY (base)/USD (quote).
Author

Christian Borjon Valencia
FXStreet
Markets analyst, news editor, and trading instructor with over 14 years of experience across FX, commodities, US equity indices, and global macro markets.