|

Elliott Wave view calling for S&P 500 to extend higher [Video]

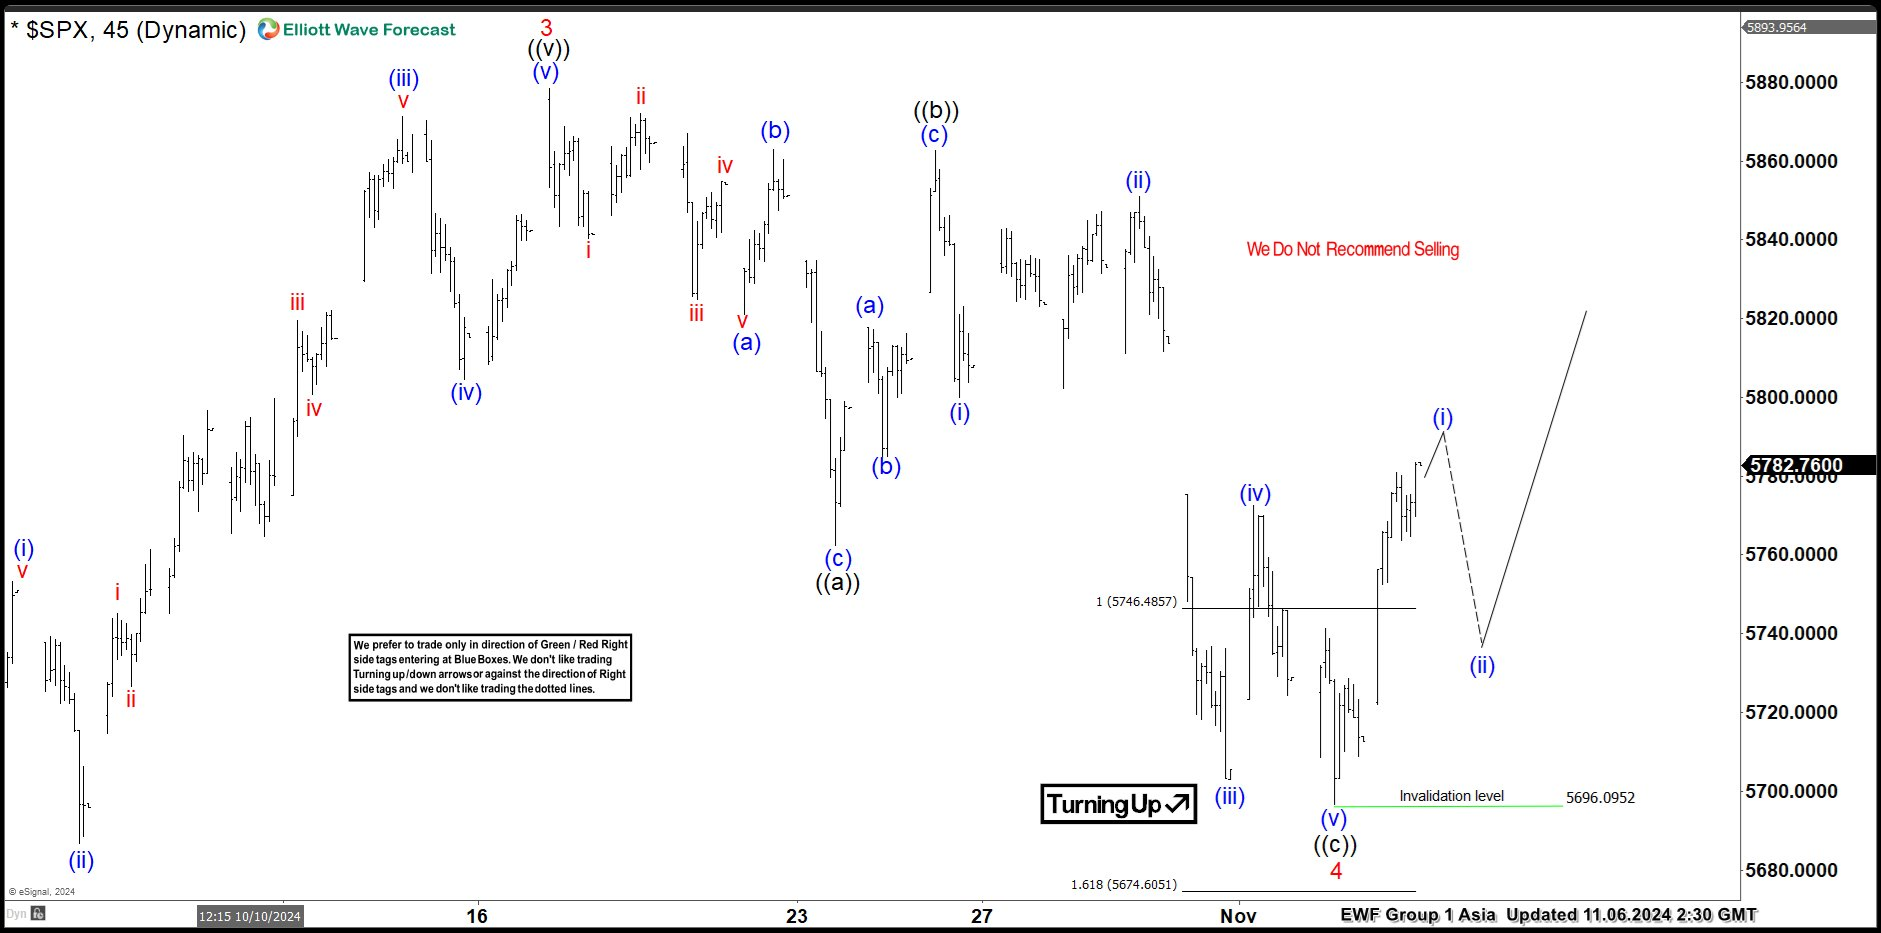
Short Term Elliott Wave View on S&P 500 (SPX) suggests rally from 8.5.2024 low is in progress as an impulse. Up from 8.5.2024 low, wave 1 ended at 5651.6 and pullback in wave 2 ended at 5402.6. Index then extended higher in wave 3 towards 5878.4 as 45 minutes chart below shows. Wave 4 pullback unfolded as a Flat Elliott Wave structure. Down from wave 3, wave (a) ended at 5821.17 and rally in wave (b) ended at 5863.04. Wave (c) lower ended at 5762.4 which completed wave ((a)) in higher degree.

Bounce in wave ((b)) unfolded as a zigzag structure. Up from wave ((a)), wave (a) ended at 5817.8 and wave (b) ended at 5784.92. Wave (c) higher ended at 5862.8 which completed wave ((b)) in higher degree. Index resumed lower in wave ((c)). Down from wave ((b)), wave (i) ended at 5802.17 and wave (ii) ended at 5850.94. Wave (iii) lower ended at 5702.8 and wave (iv) ended at 5772.5. Final leg wave (v) ended at 5696.06 which completed wave ((c)) of 4. The Index has turned higher in wave 5. Near term, as far as pivot at 5696.09 low stays intact, expect the Index to extend higher.

S&P 500 (SPX) 45 minutes Elliott Wave chart

Chart

SPX Elliott Wave [Video]

Author

Elliott Wave Forecast Team

Elliott Wave Forecast Team

ElliottWave-Forecast.com

More from Elliott Wave Forecast Team
Share:

Editor's Picks

EUR/USD treads water above 1.1850 amid thin trading

EUR/USD stays defensive but holds 1.1850 amid quiet markets in the European hours on Monday.  The US Dollar is struggling for direction due to thin liquidity conditions as US markets are closed in observance of Presidents' Day. 

GBP/USD flat lines as traders await key UK and US macro data

GBP/USD kicks off a new week on a subdued note and oscillates in a narrow range near 1.365 in Monday's European trading. The mixed fundamental backdrop warrants some caution for aggressive traders as the market focus now shifts to this week's important releases from the UK and the US.

Gold sticks to intraday losses; lacks follow-through

Gold remains depressed through the early European session on Monday, though it has managed to rebound from the daily trough and currently trades around the $5,000 psychological mark. Moreover, a combination of supporting factors warrants some caution for aggressive bearish traders, and before positioning for deeper losses.

Bitcoin, Ethereum and Ripple consolidate within key ranges as selling pressure eases

Bitcoin and Ethereum prices have been trading sideways within key ranges following the massive correction. Meanwhile, XRP recovers slightly, breaking above the key resistance zone. The top three cryptocurrencies hint at a potential short-term recovery, with momentum indicators showing fading bearish signs.

Global inflation watch: Signs of cooling services inflation

Realized inflation landed close to expectations in January, as negative base effects weighed on the annual rates. Remaining sticky inflation is largely explained by services, while tariff-driven goods inflation remains limited even in the US.

Ripple Price Forecast: XRP potential bottom could be in sight

Ripple edges up above the intraday low of $1.35 at the time of writing on Friday amid mixed price actions across the crypto market. The remittance token failed to hold support at $1.40 the previous day, reflecting risk-off sentiment amid a decline in retail and institutional sentiment.