|

Elliott Wave outlook: FTSE to signal market direction soon [Video]

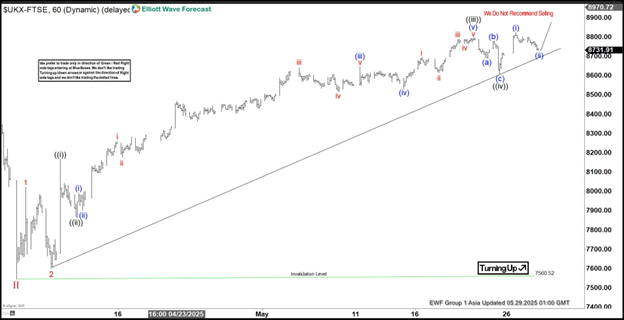
The short-term Elliott Wave outlook for FTSE indicates that wave II concluded at 7560.5. This marked the start of an upward movement in wave III. Wave III is unfolding as a five-wave impulse structure, characterized by a series of higher highs and higher lows. From the wave II low, wave 1 advanced to 8021.77, followed by a pullback in wave 2 to 7599.56. The Index then resumed its upward trajectory in wave 3, with its internal subdivisions further defining the bullish momentum.

Within wave 3, wave ((i)) peaked at 8166.53, followed by a corrective wave ((ii)) that found support at 7862.72. The subsequent rally in wave ((iii)) reached 8798.46, and a minor pullback in wave ((iv)) ended at 8604.8. The Index is now poised to continue its upward trend, likely completing the five-wave rally that began from the April 7 wave II low. Once this rally concludes, a larger corrective pullback is anticipated. The pullback is potentially unfolding in 3, 7, or 11 swings to correct the prior advance.

Currently, the Index is approaching a critical level, nearing a break above the previous wave I peak of 8908.82, recorded on March 4, 2025. A decisive move above this level would confirm that wave II is firmly in place, ruling out the possibility of a double correction. Such a breakout would provide strong confirmation of the bullish market direction, signaling continued upward momentum in the near term.

FTSE 60-minute Elliott Wave technical chart
FTSE Elliott Wave technical [Video]

Youtube preview

Author

Elliott Wave Forecast Team

Elliott Wave Forecast Team

ElliottWave-Forecast.com

More from Elliott Wave Forecast Team
Share:

Editor's Picks

GBP/USD pulls away from daily highs, tests 1.3300

GBP/USD reverses its direction and trades in the red near 1.3300 in the second half of the day on Monday after starting the week on a bullish note. Falling crude Oil prices following a pause in the Middle East conflict limits the US Dollar's gains and helps the pair hold its ground for the time being.

EUR/USD fades the initial move above 1.1400

EUR/USD loses bullish momentum and slips back below the 1.1400 region at the beginning of the week. Hopes of a de-escalation in the Middle East appears to lend support to the pair, although uncertainty persists over whether the US and Iran can reach a lasting solution.

Gold trims gains; back below $4,100

Gold trades with modest gains, fading part of the earlier move past the $4,100 mark per troy ounce on Monday. The yellow metal’s daily uptick comes amid the lack of direction in the US Dollar and renewed optimism over a temporary pause in hostilities between the US and Iran.

Bitcoin holds above key support amid ETF inflows, US-Iran bombing pause
Bitcoin (BTC) holds above the key 200-week Simple Moving Average (SMA) around $63,500, having posted four consecutive weeks of gains. Institutional demand shows mild signs of improvement with spot Exchange Traded Funds (ETFs) posting inflows for a third consecutive week.
Bitcoin options traders are dropping their hedges going into the Fed meeting
Bitcoin's options market has turned notably less defensive over the past month, unwinding the downside protection traders built up in June just as the Federal Reserve prepares to meet.
US Dollar mid-year outlook: Exceptional currency, exceptional risks?
The US Dollar enters the second half of 2026 in a markedly different position from a year ago. The King currency has recovered, reflecting persistent US inflation, changing expectations for Fed policy, geopolitical tensions and renewed demand for defensive assets.
















