|

Elliott Wave forecast: SPDR S&P 500 (SPY)’s path to record peaks [Video]

The Short-Term Elliott Wave analysis for the SPDR S&P 500 ETF (SPY), starting from August 2, indicates an ongoing impulsive rally. From the August 2 low, the ETF surged in wave ((i)) to 647.04, followed by a dip in wave ((ii)) concluding at 634.92. The ETF then climbed in wave ((iii)) to 667.34. A corrective pullback in wave ((iv)) formed a zigzag Elliott Wave pattern. From the wave ((iii)) peak, wave (a) declined to 661.98, wave (b) rallied to 664.65, and wave (c) dropped to 654.42, completing wave ((iv)).

The ETF has since resumed its upward trajectory in wave ((v)), exhibiting an impulsive structure with internal extensions. From the wave ((iv)) low, wave (i) reached 662.37, and a brief pullback in wave (ii) ended at 657.88. The ETF then nested higher, with wave i peaking at 665.8 and wave ii correcting to 660.93. Wave iii ascended to 670.74, followed by a wave iv pullback to 666.78. As long as the pivot low at 654.42 holds, the ETF should continue its upward momentum in the near term.

SPDR S&P 500 ETF (SPY) – 30-minute Elliott Wave technical chart
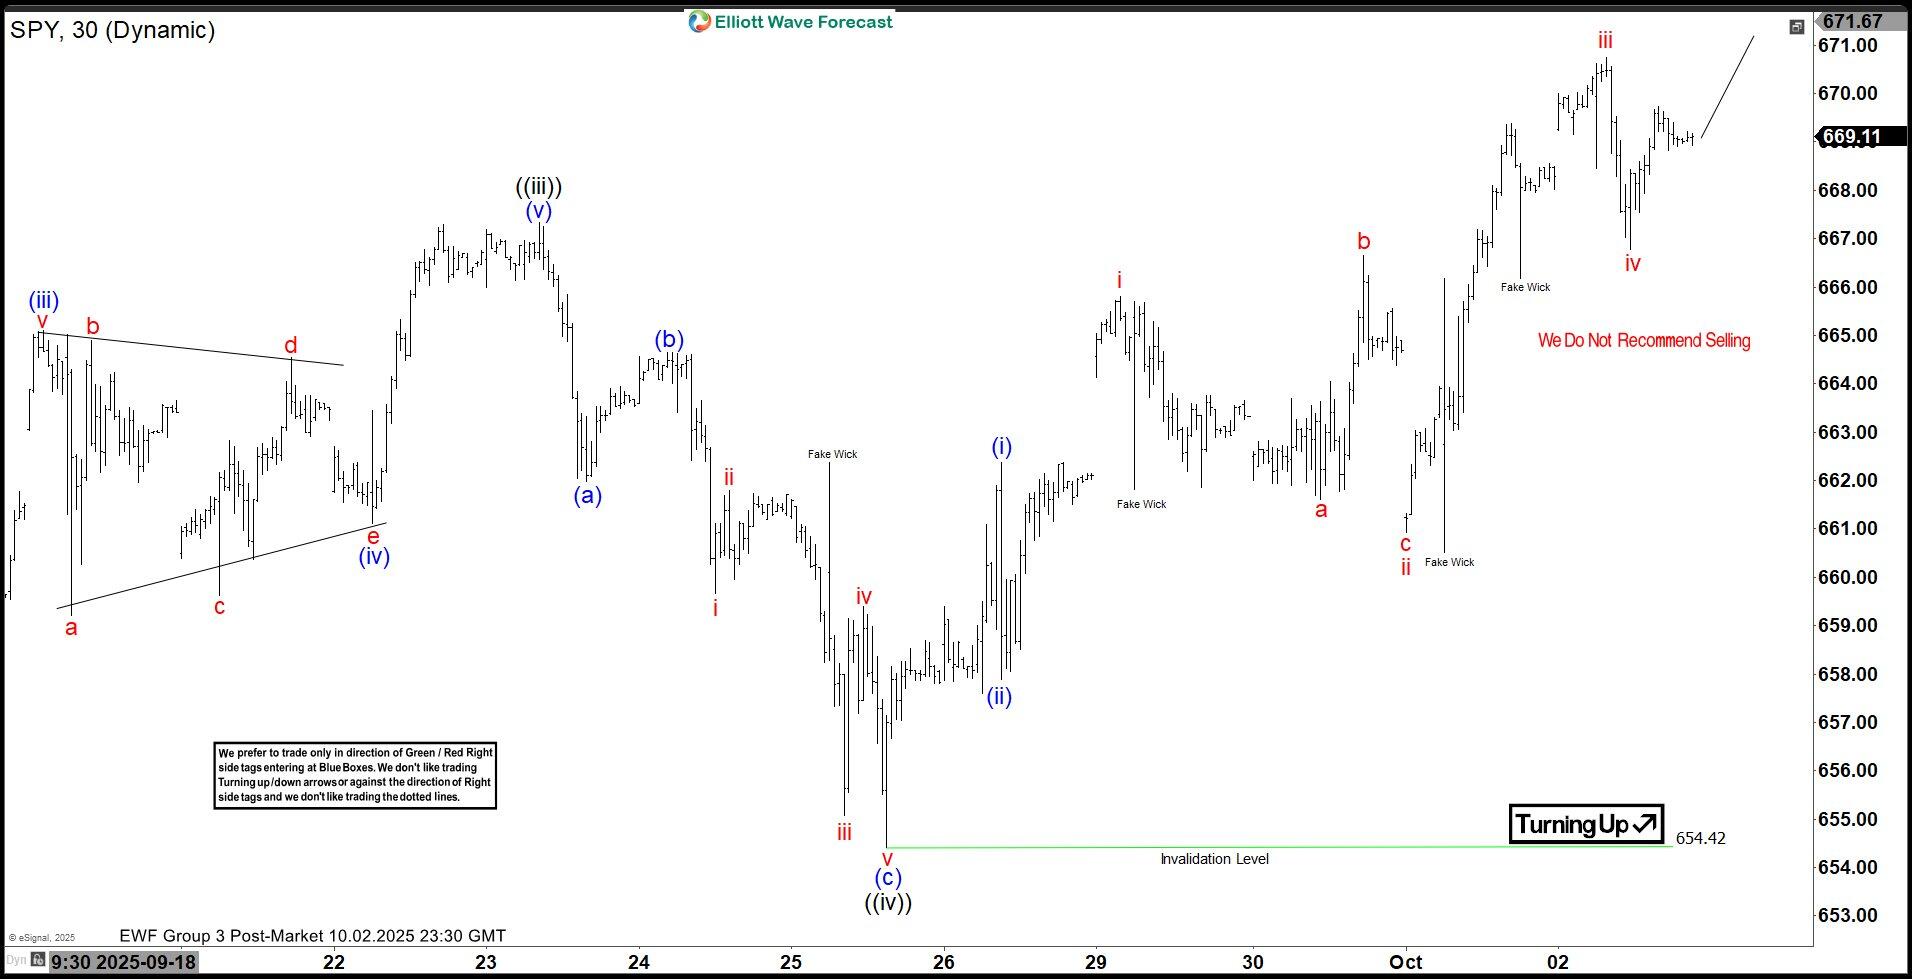
SPY – Elliott Wave technical [Video]

Youtube preview

Author

Elliott Wave Forecast Team

Elliott Wave Forecast Team

ElliottWave-Forecast.com

More from Elliott Wave Forecast Team
Share:

Editor's Picks

GBP/USD clings to 1.3500 amid marginal losses

GBP/USD alternates gains with losses around the 1.3500 neighbourhood on Tuesday. Indeed, Cable struggles to further extend its incipient recovery in a context of continuous instability in the Middle East and modest gains in the Greenback.

EUR/USD remains slightly offered near 1.1530

EUR/USD trades with humble losses in the 1.1540-1.1530 band following the closing bell in Euroland on Tuesday. Indeed, the pair’s tepid decline comes amid the marginal advance in the US Dollar, as traders continue to closely follow developments in the Middle East and gear up for the upcoming US CPI data.

Gold loses the grip below $4,400

Gold retreats from its earlier tops and briefly revisited the $4,350 region per troy ounce on Tuesday. The yellow metal’s modest retracement follows lacklustre gains in the US Dollar and declining US Treasury yields across the curve, all amid steady uncertainty from the geopolitical landscape.

Crypto Today: Bitcoin and Ethereum consolidate, XRP dips as optimism for a US-Iran deal fades

Bitcoin (BTC) maintains a neutral outlook on Tuesday while testing support at $64,000. Investors appear to be sitting on the fence, awaiting a catalyst for a breakout above $65,000.

The inflation narrative is still way more important than the employment story
Core bonds sold off yesterday with the belly of the curve slightly underperforming in the US while European curves showed more of a bear flattening. Daily changes on the US curve varied between +4.7 bps (2-yr) and +6.4 bps (7-yr).
9-3: Is the Federal Reserve’s vote tally Warsh's new forward guidance?
The rate did not move. Neither did the statement, and that’s the more interesting fact. Set the July 29 Federal Open Market Committee (FOMC) statement beside the one issued on June 17, and the two documents are identical apart from a single verb and a paragraph at the bottom naming three dissenters.