Dow Jones Industrial Average climbs nearly 750 points on Tuesday's tariff rebound
- The Dow Jones Industrial Average gained ground on Tuesday.
- Investor sentiment is rebounding after US President Trump delayed his own tariffs once again.
- Trump’s proposed additional 50% tariff on EU goods has been delayed until July 9.

The Dow Jones climbed alongside other major equities on Tuesday, with investor sentiment snapping back after last week’s declines. The Trump administration has delayed new tariff threats once again, and investors have become firmly entrenched in the belief that when United States (US) President Donald Trump threatens new tariffs, the next step will be a walkback of those tariffs. To his credit, Donald Trump has done little to break that pattern. Consumer confidence survey results also rebounded in May, snapping a five-month losing streak.
US President Trump recently mused via social media about imposing an additional 50% across-the-board tariff on all imports from the European Union (EU) beginning on June 1. However, President Trump has already walked back his own tariff threat in a pattern that has become increasingly familiar to equity markets, pushing the 50% EU tariff deadline back to July 9.
The Consumer Board (CB) Consumer Confidence print for May came in stronger than expected, with the aggregated survey index rebounding 12.3 points to 98.0 after five straight months of declines that saw the sentiment index sink to a four-year low of 85.7. Consumers’ feelings about the US economy are rebounding after getting rattled by the Trump administration’s lopsided trade strategies, and the number of surveyed consumers who expect a recession in the next 12 months fell during the May reference period.
Despite rising sentiment on President Trump’s favorite pastime of canceling or delaying his own tariff threats, analysts remain cautious. According to Adam Crisafully of Vital Knowledge, “Trump’s most bombastic tariff threats ... won’t become a reality, but he’s still imposed substantial import taxes in just the last four months, and his administration is probably not finished.”
Dow Jones price forecast
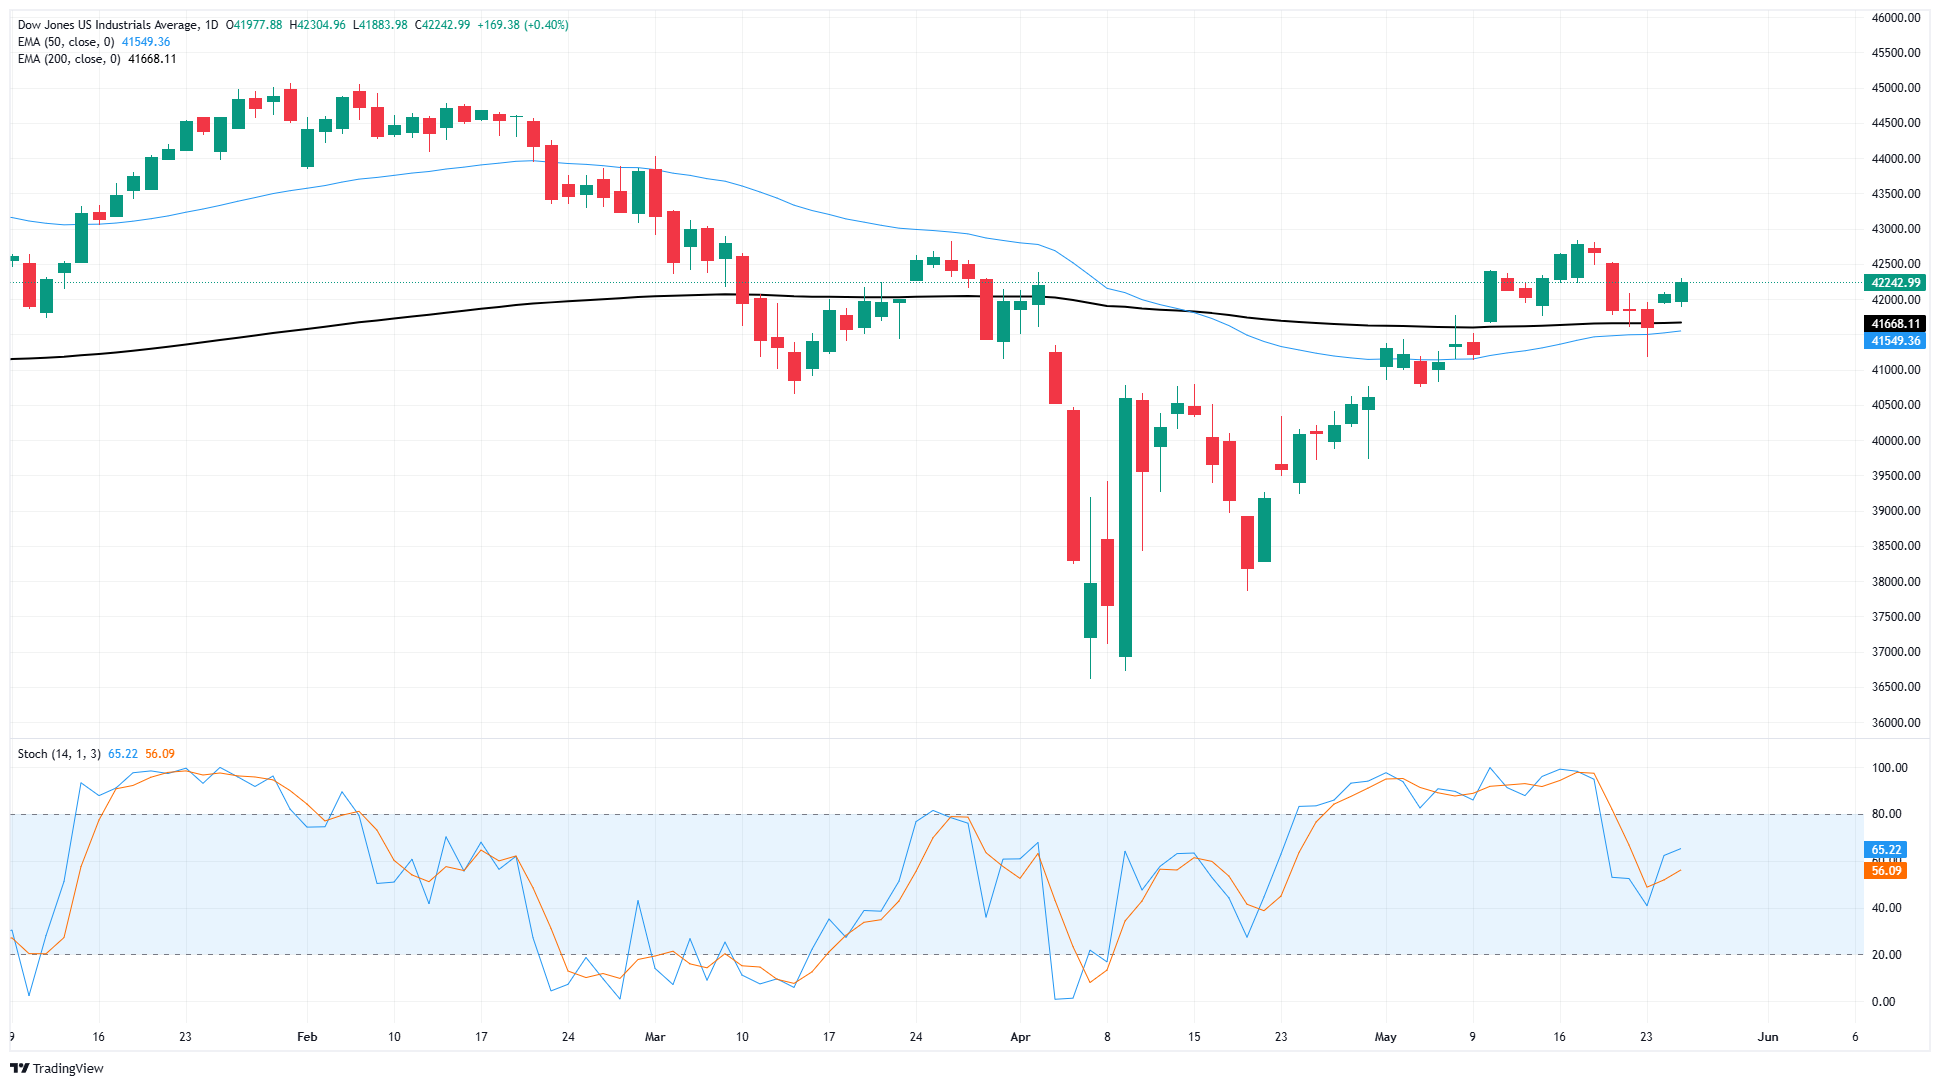
The Dow Jones gained around 750 points from last Friday’s close, forming a technical rejection of the 200-day Exponential Moving Average (EMA) and reclaiming the 42,250 level for the third time this month. The major equity index remains down from its most recent highs near the 42,800 region, but momentum favors further upward moves.
Daily candlesticks are poised to snap a lower-high pattern baked into the charts ever since the Dow Jones tumbled from record highs north of 45,000 in January. However, a firm discount window looms over the Dow as headlines about US trade policy dominate market sentiment.
Dow Jones daily chart
Dow Jones FAQs
The Dow Jones Industrial Average, one of the oldest stock market indices in the world, is compiled of the 30 most traded stocks in the US. The index is price-weighted rather than weighted by capitalization. It is calculated by summing the prices of the constituent stocks and dividing them by a factor, currently 0.152. The index was founded by Charles Dow, who also founded the Wall Street Journal. In later years it has been criticized for not being broadly representative enough because it only tracks 30 conglomerates, unlike broader indices such as the S&P 500.
Many different factors drive the Dow Jones Industrial Average (DJIA). The aggregate performance of the component companies revealed in quarterly company earnings reports is the main one. US and global macroeconomic data also contributes as it impacts on investor sentiment. The level of interest rates, set by the Federal Reserve (Fed), also influences the DJIA as it affects the cost of credit, on which many corporations are heavily reliant. Therefore, inflation can be a major driver as well as other metrics which impact the Fed decisions.
Dow Theory is a method for identifying the primary trend of the stock market developed by Charles Dow. A key step is to compare the direction of the Dow Jones Industrial Average (DJIA) and the Dow Jones Transportation Average (DJTA) and only follow trends where both are moving in the same direction. Volume is a confirmatory criteria. The theory uses elements of peak and trough analysis. Dow’s theory posits three trend phases: accumulation, when smart money starts buying or selling; public participation, when the wider public joins in; and distribution, when the smart money exits.
There are a number of ways to trade the DJIA. One is to use ETFs which allow investors to trade the DJIA as a single security, rather than having to buy shares in all 30 constituent companies. A leading example is the SPDR Dow Jones Industrial Average ETF (DIA). DJIA futures contracts enable traders to speculate on the future value of the index and Options provide the right, but not the obligation, to buy or sell the index at a predetermined price in the future. Mutual funds enable investors to buy a share of a diversified portfolio of DJIA stocks thus providing exposure to the overall index.
Author

Joshua Gibson
FXStreet
Joshua joins the FXStreet team as an Economics and Finance double major from Vancouver Island University with twelve years' experience as an independent trader focusing on technical analysis.