Dow Jones Industrial Average rebounds on a phone call and borrowed semiconductor strength
- DJIA trades near 52,480, higher by around 0.28%, clawing back only a sliver of Wednesday's Gulf-driven rout.
- Fresh US strikes on Iran and slowed Strait of Hormuz shipping keep risk appetite on a leash even as Crude Oil retreats.
- Initial Jobless Claims ease to 215K and June Existing Home Sales fall 2.4% MoM, while Fedspeak stays hawkish after the FOMC Minutes.

The Dow Jones Industrial Average (DJIA) trades near 52,484 on Thursday, higher by roughly 0.28% and recovering only a modest slice of Wednesday's rout of more than one percent, after President Donald Trump said Iran had called to make a deal. The bounce is real; the conviction underneath it is rented. The index sits some 470 points below Wednesday's early peak and roughly 850 beneath the record printed at the start of the week, and buyers have needed two sessions of dip defence just to stabilize the tape, with the afternoon push only now grinding back toward the top of the two-day range.
A ceasefire that only exists between airstrikes
The United States launched a second consecutive day of strikes on Iran, according to Central Command, after Tehran attacked commercial shipping in and around the Strait of Hormuz and slowed traffic through the waterway to a crawl. President Trump declared the ceasefire over at midweek and floated walking away from negotiations altogether, then pivoted on Thursday with the claim that Iran had phoned Washington in search of a deal. Crude Oil eased on the remark, and equities took the retreat as their permission slip to recover.
The relief carries a shelf life measured in headlines, and Wells Fargo Investment Institute's real-assets desk argues that thin global inventories mean each fresh escalation rebuilds the geopolitical premium in Crude Oil even once talks resume. Last month's peace framework has not been formally buried, but a truce that requires daily reinterpretation from the White House podium is not one markets can price with any confidence. Slower Hormuz transit is not an abstraction either, since roughly a fifth of global Crude Oil consumption moves through that strait.
Borrowed strength from a rally the index does not own
Thursday's leadership belongs almost entirely to the semiconductor complex, which trades around 3% higher as Micron and Sandisk each add roughly 7%, towing the Nasdaq and the broader benchmarks to gains near 0.3% apiece. Overseas, the story is the same tentative shade, with Europe's Stoxx 600 clawing back around 0.7% of Wednesday's near 2% drubbing while Asia splits the difference overnight.
The Dow's price-weighted construction leaves most of that semiconductor squeeze outside its walls, so the blue-chip average is effectively drafting behind a trade it barely owns. Inside the average itself the picture is messier, with Salesforce trading more than 4% lower after a broker downgrade questioned where the next leg of upside comes from, while the cyclical and consumer heavyweights carry the fuel-cost and shipping beta radiating out of the Gulf; materials ranked as Wednesday's worst-performing sector for exactly that reason.
Good data keeps the Federal Reserve pointed the wrong way
The Minutes of the June Federal Open Market Committee (FOMC) meeting, released Wednesday, stressed that upside inflation risks remain intact while labour-market concerns have eased. A permanent FOMC voter reinforced the message on Thursday with remarks that scored firmly hawkish, and rate markets now attach roughly one-in-ten odds to a hike at the late-July meeting, with no cuts priced anywhere near term. The committee that stripped its easing bias out in June has shown no interest in handing it back.
Thursday's data hands the hawks more rope, with Initial Jobless Claims printing 215K against a 218K consensus and a prior 217K for the lowest weekly reading since late May, while continuing claims edged up 8K to 1.814 million. June Existing Home Sales fell 2.4% MoM against expectations for a gain near 0.7%, easing to an annualized pace of 4.9 million despite rising 2.8% YoY, a reminder that housing feels every basis point the committee refuses to surrender. The rate-sensitive corners of the economy already creak, and the labour market refuses to justify relief.
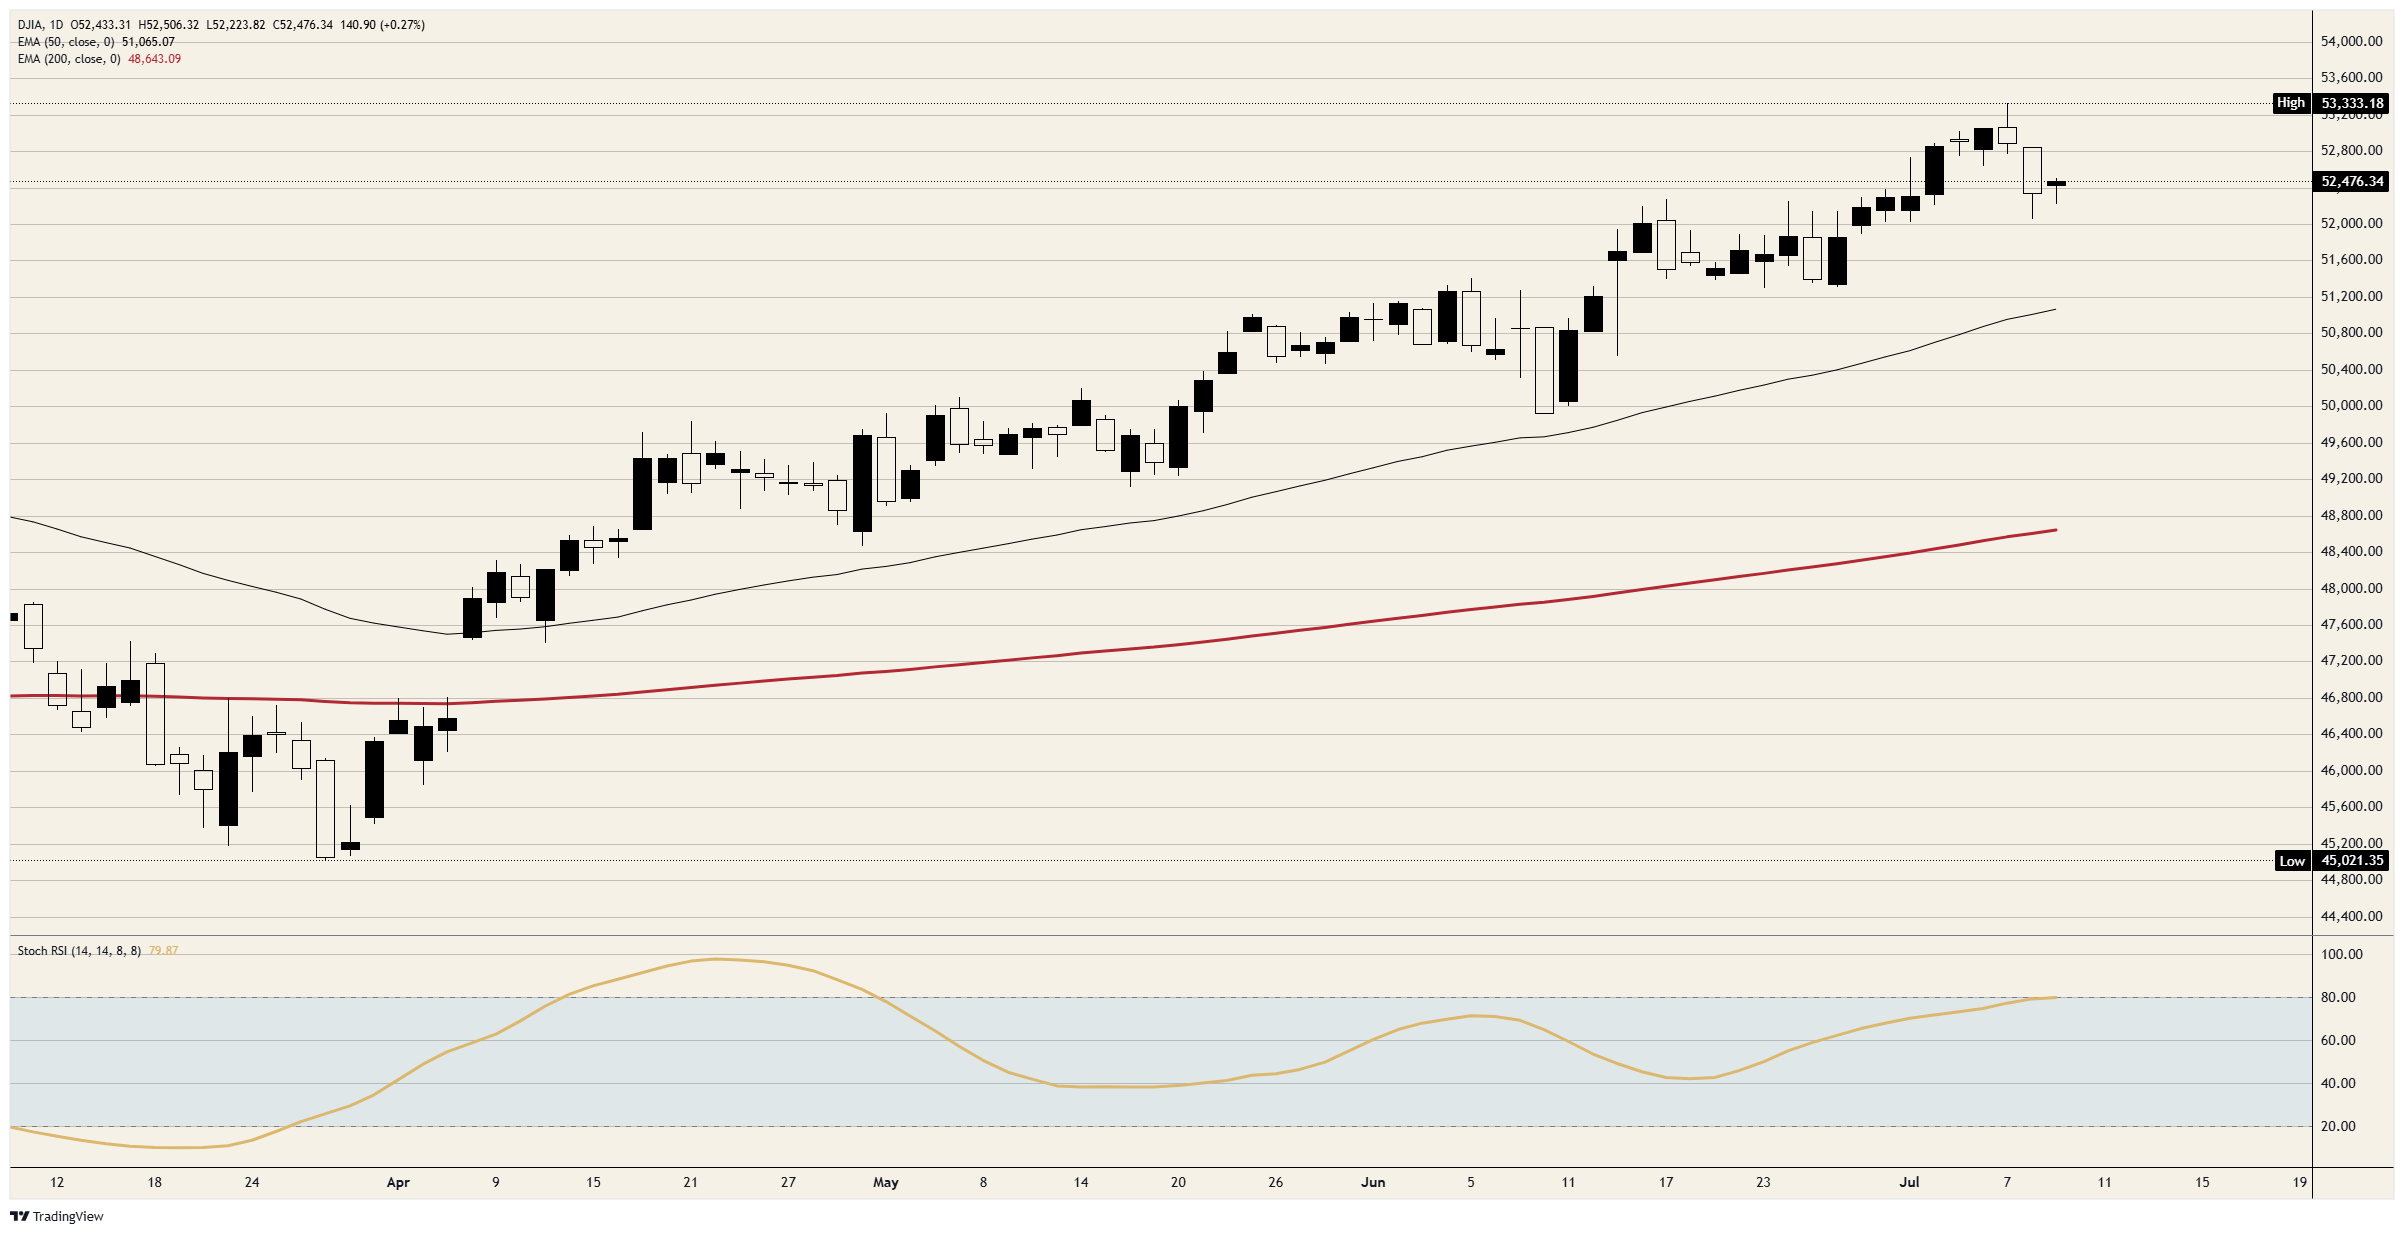
Geopolitics therefore constrains this tape twice over, once through risk appetite and once through the policy channel, because the Hormuz premium in Crude Oil feeds the exact inflation risk the Minutes flagged. Momentum offers little rescue either, as the daily Stochastic Relative Strength Index already presses the overbought boundary with the index still 850 points under its record; the recovery is present, but it runs on borrowed strength and a single phone call.
Dow Jones Industrial Average technical levels
Resistance: The 52,954 region, Wednesday's early peak, caps the immediate recovery, and beyond it only the record high at 53,333 stands overhead.
Support: Thursday's floor at 52,224 provides the first shelf, ahead of Wednesday's washout low at 52,056; losing that level puts the round 52,000 handle straight into play.
Bias: Bullish while 52,056 holds, with dip buyers defending the lows in consecutive sessions, but the recovery stays capped below 52,954 until the Gulf story produces a deal rather than a phone call; a daily close above that barrier is the trigger that reopens 53,333.
Dow Jones daily chart
Dow Jones FAQs
The Dow Jones Industrial Average, one of the oldest stock market indices in the world, is compiled of the 30 most traded stocks in the US. The index is price-weighted rather than weighted by capitalization. It is calculated by summing the prices of the constituent stocks and dividing them by a factor, currently 0.152. The index was founded by Charles Dow, who also founded the Wall Street Journal. In later years it has been criticized for not being broadly representative enough because it only tracks 30 conglomerates, unlike broader indices such as the S&P 500.
Many different factors drive the Dow Jones Industrial Average (DJIA). The aggregate performance of the component companies revealed in quarterly company earnings reports is the main one. US and global macroeconomic data also contributes as it impacts on investor sentiment. The level of interest rates, set by the Federal Reserve (Fed), also influences the DJIA as it affects the cost of credit, on which many corporations are heavily reliant. Therefore, inflation can be a major driver as well as other metrics which impact the Fed decisions.
Dow Theory is a method for identifying the primary trend of the stock market developed by Charles Dow. A key step is to compare the direction of the Dow Jones Industrial Average (DJIA) and the Dow Jones Transportation Average (DJTA) and only follow trends where both are moving in the same direction. Volume is a confirmatory criteria. The theory uses elements of peak and trough analysis. Dow’s theory posits three trend phases: accumulation, when smart money starts buying or selling; public participation, when the wider public joins in; and distribution, when the smart money exits.
There are a number of ways to trade the DJIA. One is to use ETFs which allow investors to trade the DJIA as a single security, rather than having to buy shares in all 30 constituent companies. A leading example is the SPDR Dow Jones Industrial Average ETF (DIA). DJIA futures contracts enable traders to speculate on the future value of the index and Options provide the right, but not the obligation, to buy or sell the index at a predetermined price in the future. Mutual funds enable investors to buy a share of a diversified portfolio of DJIA stocks thus providing exposure to the overall index.
Author

Joshua Gibson
FXStreet
Joshua joins the FXStreet team as an Economics and Finance double major from Vancouver Island University with twelve years' experience as an independent trader focusing on technical analysis.