Bitcoin Price Forecast: BTC stalls as mixed ETF flows, renewed US-Iran tensions cap upside
- Bitcoin trades at $63,000 on Thursday, recovering slightly after facing rejection near $64,000.
- Mixed spot ETF flows so far this week indicate indecisive and cautious market sentiment.
- Renewed geopolitical uncertainty has dampened risk appetite, limiting BTC upside potential.

Bitcoin (BTC) recovers slightly, trading above $63,000 on Thursday after facing rejection near the $64,000 resistance zone earlier this week. Mixed spot Exchange Traded Funds (ETFs) flows so far this week reflect cautious institutional positioning, while renewed US-Iran tensions continue to dampen risk appetite, limiting the Crypto King’s upside potential.
Renewed US-Iran tensions cap BTC
The fragile US-Iran relationship took a new turn this week, with the US military unleashing a new wave of strikes against Iran in retaliation for Tehran’s attacks on commercial ships in the Strait of Hormuz.
Iran responded by continuously targeting US military installations and assets across Bahrain and Kuwait. Adding to this, US President Donald Trump said on Wednesday that the ceasefire agreement with Iran was "over".
In addition to the growing tensions, the FOMC Minutes from the June 16–17 meeting were released on Wednesday and revealed that policymakers were divided over the direction of interest rates. The minutes reflected growing concern among Fed officials over inflation just as worries about the labor market slightly receded.
Following the release, swap traders are now pricing the likelihood of a rate hike at the next Fed meeting in July at more than 27%, up from less than 20% last Thursday, according to the CME FedWatch tool.
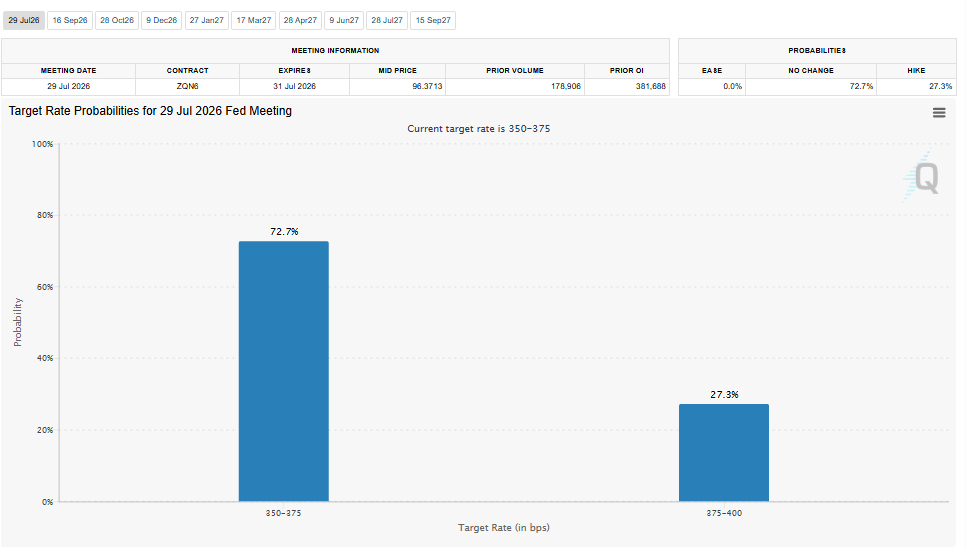
The renewed geopolitical uncertainty and a hawkish shift in rate expectations have dampened risk appetite, weighing on cryptocurrencies, with Bitcoin (BTC) struggling to hold above the $64,000 resistance.
Mixed institutional demand
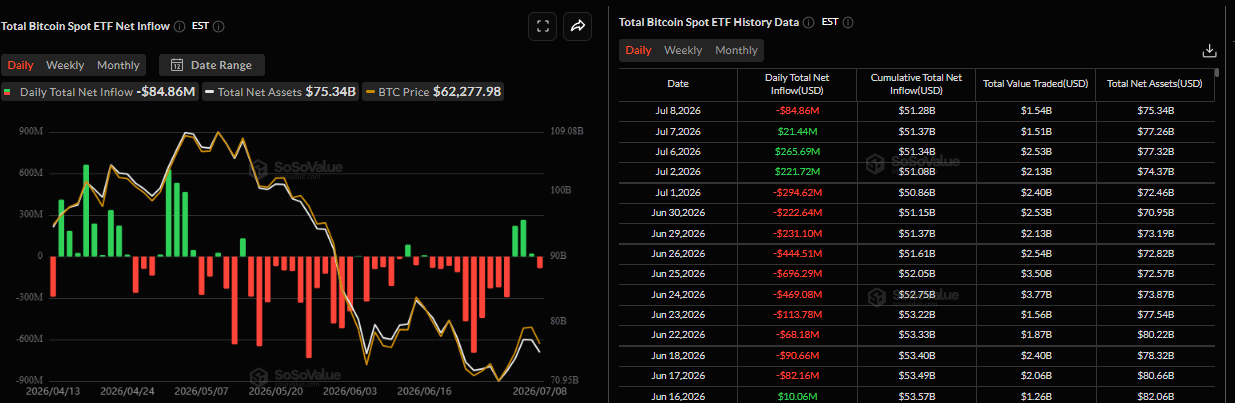
As highlighted in the previous report, institutional demand revived slightly over the first two days of this week, following several weeks of outflows. However, SoSoValue data showed that spot BTC ETFs recorded an outflow of $84.86 million on Wednesday. These mixed flows so far this week reflect cautious institutional positioning amid the growing geopolitical tensions. Moreover, if the outflow trend resumes and intensifies, BTC could see further correction.
Some signs of optimism
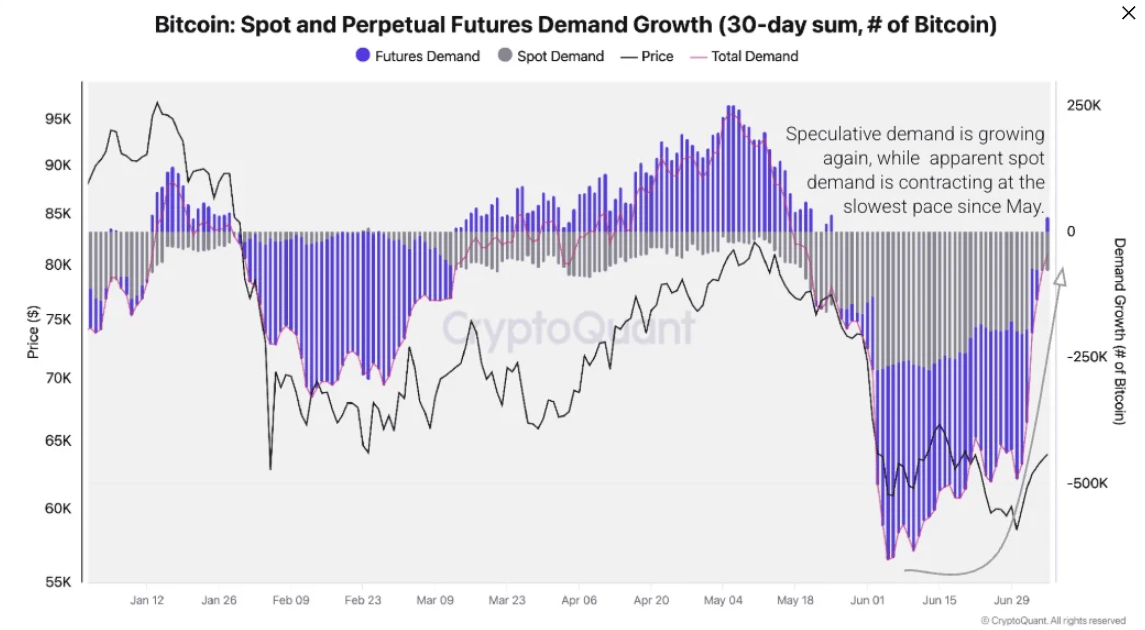
CryptoQuant’s weekly report on Wednesday highlighted some mild signs of optimism. According to the report, the July rally may be supported by total Bitcoin demand swinging back toward neutral after its sharpest contraction since 2022.
The chart below shows that the 30-day change in total demand (spot plus perpetual futures) collapsed to roughly -650,000 BTC in early June, the most negative reading since 2022, as Bitcoin fell toward $58,000. It has since recovered to near neutral, with speculative futures demand turning slightly positive while spot apparent demand contracts at its slowest pace since mid-May.
“A move back into positive territory would confirm that the demand engine is re-igniting,” said CryptoQuant’s analyst.
Bitcoin Price Forecast: Can BTC reclaim $64,000 or is $60,000 coming next?
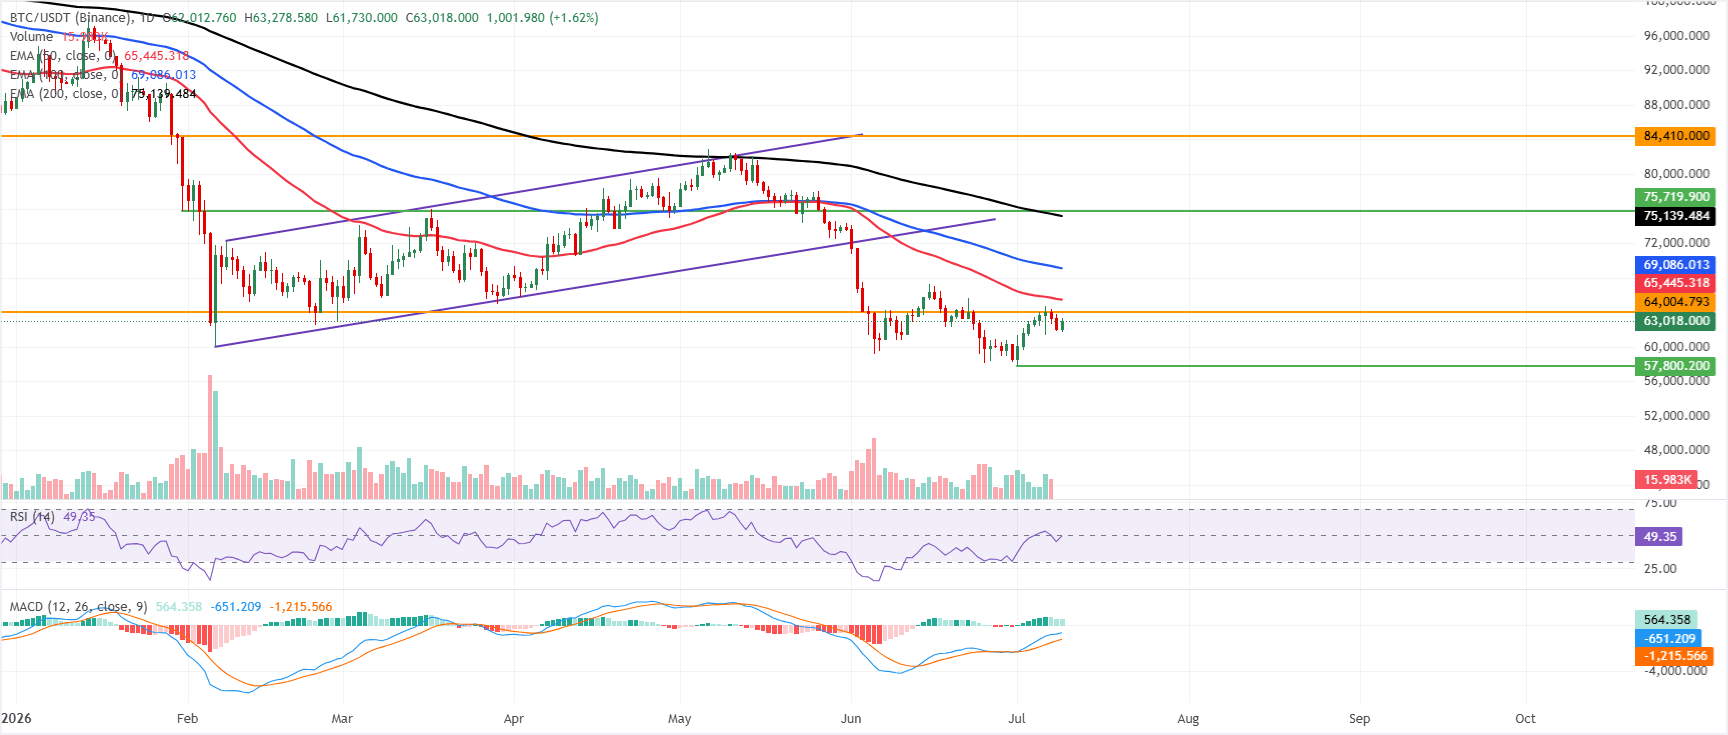
Bitcoin price trades at $63,018 on Thursday, recovering slightly after rejecting from the $64,000 key resistance zone earlier this week. BTC maintains a bearish near-term bias as it remains capped beneath a dense pack of Exponential Moving Averages. The 50-day EMA at $65,445, the 100-day EMA at $69,086 and the 200-day EMA at $75,139 all sit overhead, suggesting any rebound would still unfold within a broader corrective phase.
Momentum has improved, with the Relative Strength Index (RSI) on the daily chart hovering just below the neutral 50 line at 49 on Thursday and the Moving Average Convergence Divergence (MACD) indicator remaining in positive territory. This combination hints more at stabilizing downside pressure than at a clear bullish reversal while price trades under these trend filters.
On the topside, immediate resistance is seen at the horizontal barrier near $64,004, ahead of the 50-day EMA at $65,445, reinforcing the first supply zone. A break higher would expose the 100-day EMA at $69,086, followed by the longer-term 200-day EMA at $75,139, before the major structural cap at $84,410 comes into view.
With no meaningful support levels defined by the current indicator set, any fresh pullback from these resistances would likely rely on key psychological levels around $60,000. Any renewed selling below $60,000 would extend the correction toward the yearly low of $57,800 seen on July 1.
(The technical analysis of this story was written with the help of an AI tool. Know more.)
Bitcoin, altcoins, stablecoins FAQs
Bitcoin is the largest cryptocurrency by market capitalization, a virtual currency designed to serve as money. This form of payment cannot be controlled by any one person, group, or entity, which eliminates the need for third-party participation during financial transactions.
Altcoins are any cryptocurrency apart from Bitcoin, but some also regard Ethereum as a non-altcoin because it is from these two cryptocurrencies that forking happens. If this is true, then Litecoin is the first altcoin, forked from the Bitcoin protocol and, therefore, an “improved” version of it.
Stablecoins are cryptocurrencies designed to have a stable price, with their value backed by a reserve of the asset it represents. To achieve this, the value of any one stablecoin is pegged to a commodity or financial instrument, such as the US Dollar (USD), with its supply regulated by an algorithm or demand. The main goal of stablecoins is to provide an on/off-ramp for investors willing to trade and invest in cryptocurrencies. Stablecoins also allow investors to store value since cryptocurrencies, in general, are subject to volatility.
Bitcoin dominance is the ratio of Bitcoin's market capitalization to the total market capitalization of all cryptocurrencies combined. It provides a clear picture of Bitcoin’s interest among investors. A high BTC dominance typically happens before and during a bull run, in which investors resort to investing in relatively stable and high market capitalization cryptocurrency like Bitcoin. A drop in BTC dominance usually means that investors are moving their capital and/or profits to altcoins in a quest for higher returns, which usually triggers an explosion of altcoin rallies.
Author

Manish Chhetri
FXStreet
Manish Chhetri is a crypto specialist with over four years of experience in the cryptocurrency industry.




