Dow Jones Industrial Average middles ahead of key inflation report
- The Dow Jones struggled to find momentum in either direction on Thursday.
- Nvidia posted strong revenue figures, but a lack of China chip sales stunted AI bidders.
- A fresh round of US PCE inflation, due on Friday, is keeping investors at bay.

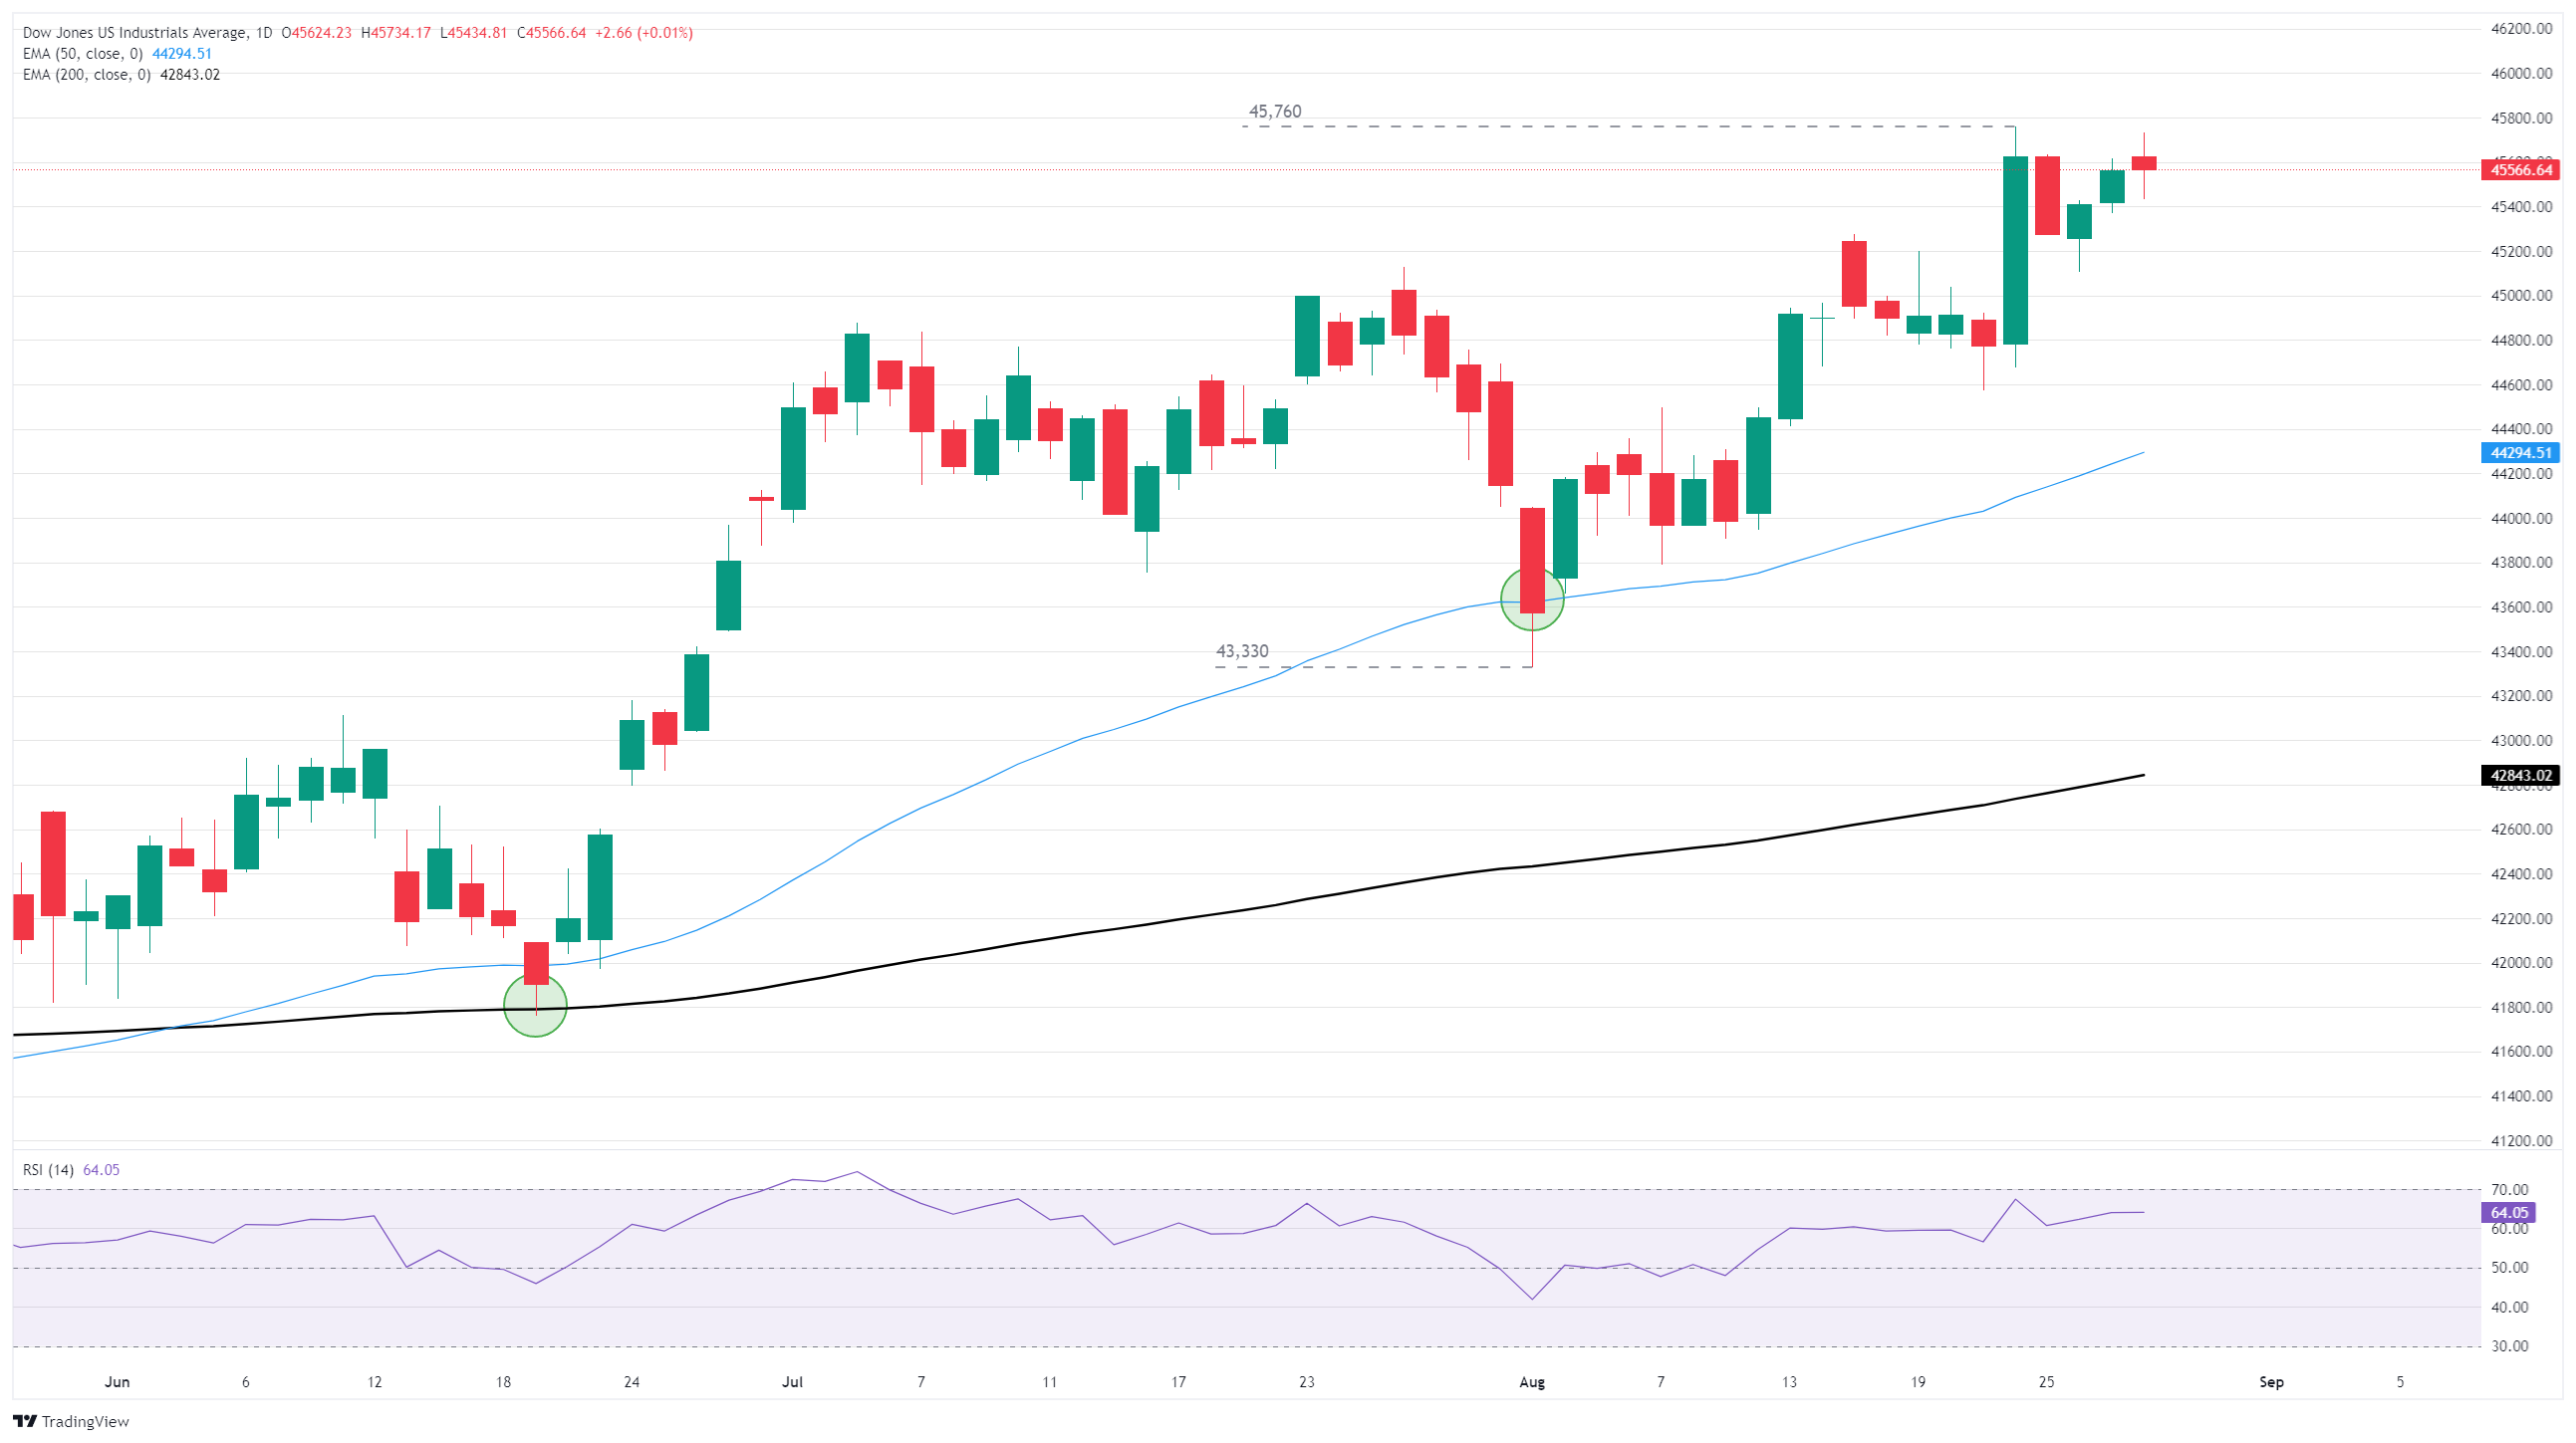
The Dow Jones Industrial Average (DJIA) ground to a halt on Thursday, stuck near the 45,500 region as investors await the latest batch of United States (US) Personal Consumption Expenditures Price Index (PCE) inflation data, due on Friday. The Dow is still holding close to record highs reached last week, but further topside momentum will require further evidence that markets are going to get their long-awaited interest rate cut in September.
Nvidia earns a beatdown after growing revenue by just 56%
AI tech rally monolith Nvidia (NVDA) posted strong quarterly revenue results after the closing bell on Wednesday, prompting a flurry of after-hours stock trading. However, despite posting revenue growth of 56% in the second quarter, Nvidia still saw overnight declines after investors noticed the chipmaker’s forward guidance didn’t include any additional chip sales to China. Nvidia is still actively negotiating with the Trump administration to gain more market access to China, specifically for bulk sales of its H20 chipsets tailored to service AI industry buildouts.
Other global chipmakers fell in tandem with Nvidia before tech bidders recovered their footing and pared away the brunt of the overnight session’s damage. NVDA remains down around 2.3% from record highs, recovering back above $180.00 per share after tapping the $172.00 region post-revenue reporting.
Read more Nvidia stock news: After earnings sell-off, Nvidia stock regains $180
PCE inflation remains the key datapoint this week
US Gross Domestic Product (GDP) growth accelerated to 3.3% on an annualized basis through the second quarter, beating expectations and accelerating from the previous quarter’s 3.0%. However, data impact on Thursday is limited as investors are pre-emptively bracing for Friday’s PCE inflation print. Inflation remains a looming threat to the trajectory of Fed rate cuts and could undermine September rate cut hopes if it accelerates too quickly between now and September 17. July’s core PCE inflation is expected to rise to 2.9% YoY.
Dow Jones daily chart
Dow Jones FAQs
The Dow Jones Industrial Average, one of the oldest stock market indices in the world, is compiled of the 30 most traded stocks in the US. The index is price-weighted rather than weighted by capitalization. It is calculated by summing the prices of the constituent stocks and dividing them by a factor, currently 0.152. The index was founded by Charles Dow, who also founded the Wall Street Journal. In later years it has been criticized for not being broadly representative enough because it only tracks 30 conglomerates, unlike broader indices such as the S&P 500.
Many different factors drive the Dow Jones Industrial Average (DJIA). The aggregate performance of the component companies revealed in quarterly company earnings reports is the main one. US and global macroeconomic data also contributes as it impacts on investor sentiment. The level of interest rates, set by the Federal Reserve (Fed), also influences the DJIA as it affects the cost of credit, on which many corporations are heavily reliant. Therefore, inflation can be a major driver as well as other metrics which impact the Fed decisions.
Dow Theory is a method for identifying the primary trend of the stock market developed by Charles Dow. A key step is to compare the direction of the Dow Jones Industrial Average (DJIA) and the Dow Jones Transportation Average (DJTA) and only follow trends where both are moving in the same direction. Volume is a confirmatory criteria. The theory uses elements of peak and trough analysis. Dow’s theory posits three trend phases: accumulation, when smart money starts buying or selling; public participation, when the wider public joins in; and distribution, when the smart money exits.
There are a number of ways to trade the DJIA. One is to use ETFs which allow investors to trade the DJIA as a single security, rather than having to buy shares in all 30 constituent companies. A leading example is the SPDR Dow Jones Industrial Average ETF (DIA). DJIA futures contracts enable traders to speculate on the future value of the index and Options provide the right, but not the obligation, to buy or sell the index at a predetermined price in the future. Mutual funds enable investors to buy a share of a diversified portfolio of DJIA stocks thus providing exposure to the overall index.
Author

Joshua Gibson
FXStreet
Joshua joins the FXStreet team as an Economics and Finance double major from Vancouver Island University with twelve years' experience as an independent trader focusing on technical analysis.


