Dow Jones Industrial Average whipsaws, Tuesday's US CPI inflation a mixed bag
- Dow Jones tests 39,060.00 before settling back into the opening range.
- US CPI inflation continues to ease overall, but MoM headline CPI ticked higher.
- Equity indexes are broadly on the rise, but DJIA remains capped.

The Down Jones Industrial Average (DJIA) rose moderately on Tuesday, with US equities finding gains after a somewhat mixed US Consumer Price Index (CPI) inflation print flashed an uptick in near-term inflation, but investor confidence remains hopeful as Core CPI inflation continues to ease. The DJIA ended Tuesday in the green by six tenths of a percent, climbing 235.83 points but underperforming the other major equity indexes. The S&P 500 index gained 1.54% after rising 246.36 points and the NASDAQ Composite ended the day up 57.33 points, closing up 1.12%.
Markets continue to pin hopes on a rate cut from the Federal Reserve (Fed) happening sooner rather than later. According to the CME’s FedWatch Tool, rate markets are continuing to price in a 70% chance of at least a 25 basis point rate trim from the Fed at its June policy meeting. Going further into the details, about 63% of rate futures traders expect a 25 bps cut, while 7% are hoping for a 50 bps rate cut in June.
Dow Jones news: 3M climbs nearly 5%, Boeing continues to shed weight
3M Co. (MMM) is the top performer listed on the Dow Jones Industrial Average, rising 4.8% by midday to trade into $98.60. 3M gained ground after the company announced that William Brown, the former CEO of L3Harris Technologies (LHX) will take over the helm at 3M beginning May 1.
Boeing Co. (BA) continues to decline as the company gets buried underneath negative headlines. The stock slipped 4.8% on Tuesday, declining to $183.30. The death of a former whistleblower who worked at the aerospace company adds further negative pressure to the already-pummeled stock and is piling onto a 10% decline in BO over the past month.
US CPI inflation continues to moderate, but near-term heat persists
MoM headline US CPI inflation ticked up to 0.4% in February, accelerating from the previous 0.3%, with YoY CPI inflation rising to 3.2% compared to the forecast hold at 3.1%. Core CPI numbers eased, but not as much as markets were hoping for, with MoM Core CPI holding at 0.4% instead of declining to the forecast 0.3%. YoY Core CPI ticked down to 3.8% from the previous 3.9%, but missed market forecasts of 3.7%.
Read More: US CPI inflation rises to 3.2% in February vs. 3.1% expected
An uptick in energy costs drove the uptick in near-term headline CPI, with over 60% of the increase in MoM CPI inflation coming from gasoline and shelter costs from owner’s equivalent rent.
According to Robert Frick, corporate economist at Navy Federal Credit Union, “Inflation continues to churn above 3%, and once again shelter costs were the main villain. With home prices expected to rise this year and rents falling only slowly, the long-awaited fall in shelter prices isn’t coming to the rescue any time soon.” Frick continued, “Reports like January’s and February’s aren’t going to prompt the Fed to lower rates quickly.”
Dow Jones Industrial Average technical outlook
The Dow Jones Industrial Average (DJIA) kicked off Tuesday’s trading near 38,820.00, whipsawing into a daily low near 38,600.00 on reaction to the mixed US CPI print before recovering and staging a thin rally into 39,060.00. The index continued a mixed grind with an intraday bull run ending just shy of 39,075.00 and wrapping up the US trading session just north of the 39,000.00 handle.
Profit-taking and headline fades dragged the equity index back into the day’s opening range and the major index will head into Wednesday's trading session challenging chart territory around the 39,000.00 major price handle.
Dow Jones chart, 5-minute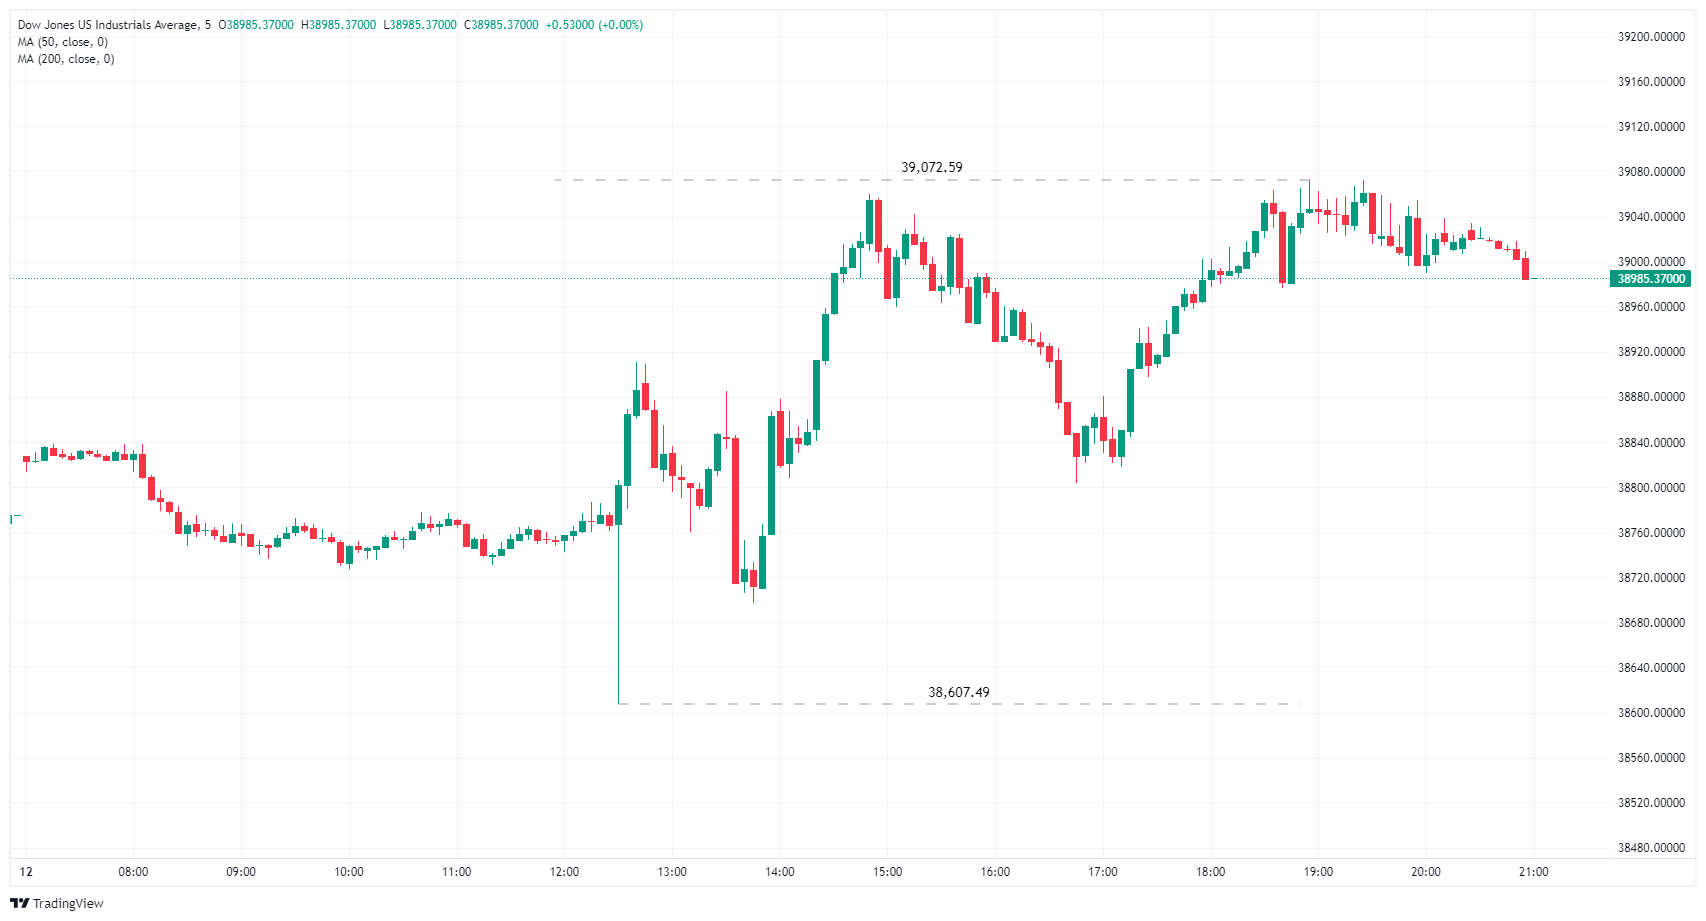
Dow Jones FAQs
The Dow Jones Industrial Average, one of the oldest stock market indices in the world, is compiled of the 30 most traded stocks in the US. The index is price-weighted rather than weighted by capitalization. It is calculated by summing the prices of the constituent stocks and dividing them by a factor, currently 0.152. The index was founded by Charles Dow, who also founded the Wall Street Journal. In later years it has been criticized for not being broadly representative enough because it only tracks 30 conglomerates, unlike broader indices such as the S&P 500.
Many different factors drive the Dow Jones Industrial Average (DJIA). The aggregate performance of the component companies revealed in quarterly company earnings reports is the main one. US and global macroeconomic data also contributes as it impacts on investor sentiment. The level of interest rates, set by the Federal Reserve (Fed), also influences the DJIA as it affects the cost of credit, on which many corporations are heavily reliant. Therefore, inflation can be a major driver as well as other metrics which impact the Fed decisions.
Dow Theory is a method for identifying the primary trend of the stock market developed by Charles Dow. A key step is to compare the direction of the Dow Jones Industrial Average (DJIA) and the Dow Jones Transportation Average (DJTA) and only follow trends where both are moving in the same direction. Volume is a confirmatory criteria. The theory uses elements of peak and trough analysis. Dow’s theory posits three trend phases: accumulation, when smart money starts buying or selling; public participation, when the wider public joins in; and distribution, when the smart money exits.
There are a number of ways to trade the DJIA. One is to use ETFs which allow investors to trade the DJIA as a single security, rather than having to buy shares in all 30 constituent companies. A leading example is the SPDR Dow Jones Industrial Average ETF (DIA). DJIA futures contracts enable traders to speculate on the future value of the index and Options provide the right, but not the obligation, to buy or sell the index at a predetermined price in the future. Mutual funds enable investors to buy a share of a diversified portfolio of DJIA stocks thus providing exposure to the overall index.
Inflation FAQs
Inflation measures the rise in the price of a representative basket of goods and services. Headline inflation is usually expressed as a percentage change on a month-on-month (MoM) and year-on-year (YoY) basis. Core inflation excludes more volatile elements such as food and fuel which can fluctuate because of geopolitical and seasonal factors. Core inflation is the figure economists focus on and is the level targeted by central banks, which are mandated to keep inflation at a manageable level, usually around 2%.
The Consumer Price Index (CPI) measures the change in prices of a basket of goods and services over a period of time. It is usually expressed as a percentage change on a month-on-month (MoM) and year-on-year (YoY) basis. Core CPI is the figure targeted by central banks as it excludes volatile food and fuel inputs. When Core CPI rises above 2% it usually results in higher interest rates and vice versa when it falls below 2%. Since higher interest rates are positive for a currency, higher inflation usually results in a stronger currency. The opposite is true when inflation falls.
Although it may seem counter-intuitive, high inflation in a country pushes up the value of its currency and vice versa for lower inflation. This is because the central bank will normally raise interest rates to combat the higher inflation, which attract more global capital inflows from investors looking for a lucrative place to park their money.
Formerly, Gold was the asset investors turned to in times of high inflation because it preserved its value, and whilst investors will often still buy Gold for its safe-haven properties in times of extreme market turmoil, this is not the case most of the time. This is because when inflation is high, central banks will put up interest rates to combat it. Higher interest rates are negative for Gold because they increase the opportunity-cost of holding Gold vis-a-vis an interest-bearing asset or placing the money in a cash deposit account. On the flipside, lower inflation tends to be positive for Gold as it brings interest rates down, making the bright metal a more viable investment alternative.
Author

Joshua Gibson
FXStreet
Joshua joins the FXStreet team as an Economics and Finance double major from Vancouver Island University with twelve years' experience as an independent trader focusing on technical analysis.


