Dow Jones forecast: Oversold breadth signals pullback exhaustion, fresh record highs ahead?

On August 6, we flagged a rare Dow Jones Industrial Average (DJIA) setup suggesting a pullback: two consecutive daily sessions with both the open and close entirely above the upper 20-day, 2-standard-deviation Bollinger Band, capped by an August 5 shooting star.
Two weeks later, we posted that a five-wave decline to 50,250-750 was the most likely path. Ideally, the 3rd wave would reach 51,000 +/- 250, and the 4th wave 52,250 +/- 250. Fast forward to today, the index bottomed out at 51,186 on September 16 for W-3, peaked at 52,319 for W-4 on September 22, and is now trading in the low 51,000s for W-5. See Figure 1 below.
Figure 1: Dow Jones Daily chart with our short-term Elliott wave count and several technical indicators
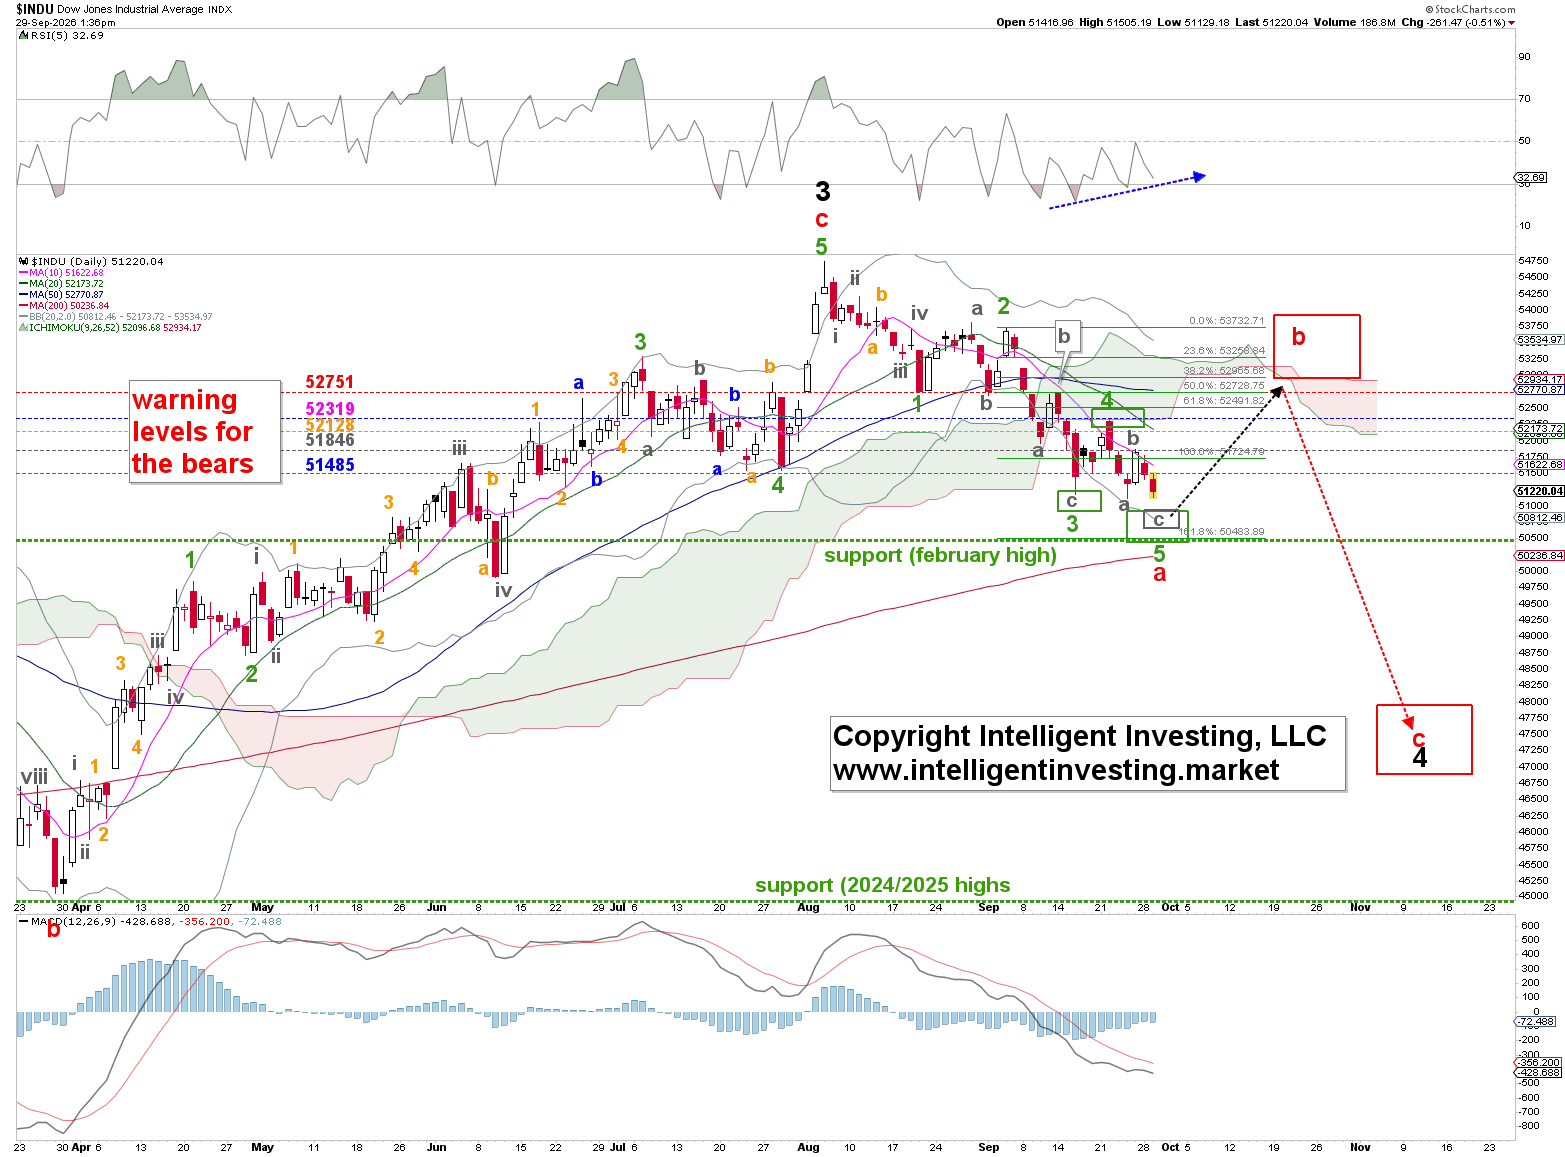
The daily chart shows support around 50,500, the February high. In addition, the green 161.8% Fibonacci extension of W-1, measured from W-2, sits at ~50,484, and the gray W-c of W-5 targets ~50,900 +/- 100. Lastly, a potential double-positive divergence is forming on the daily RSI5 (dotted blue arrow), while the MACD is oversold. Thus, downside risk vs. upside reward over the next few days to weeks appears skewed toward upside reward.
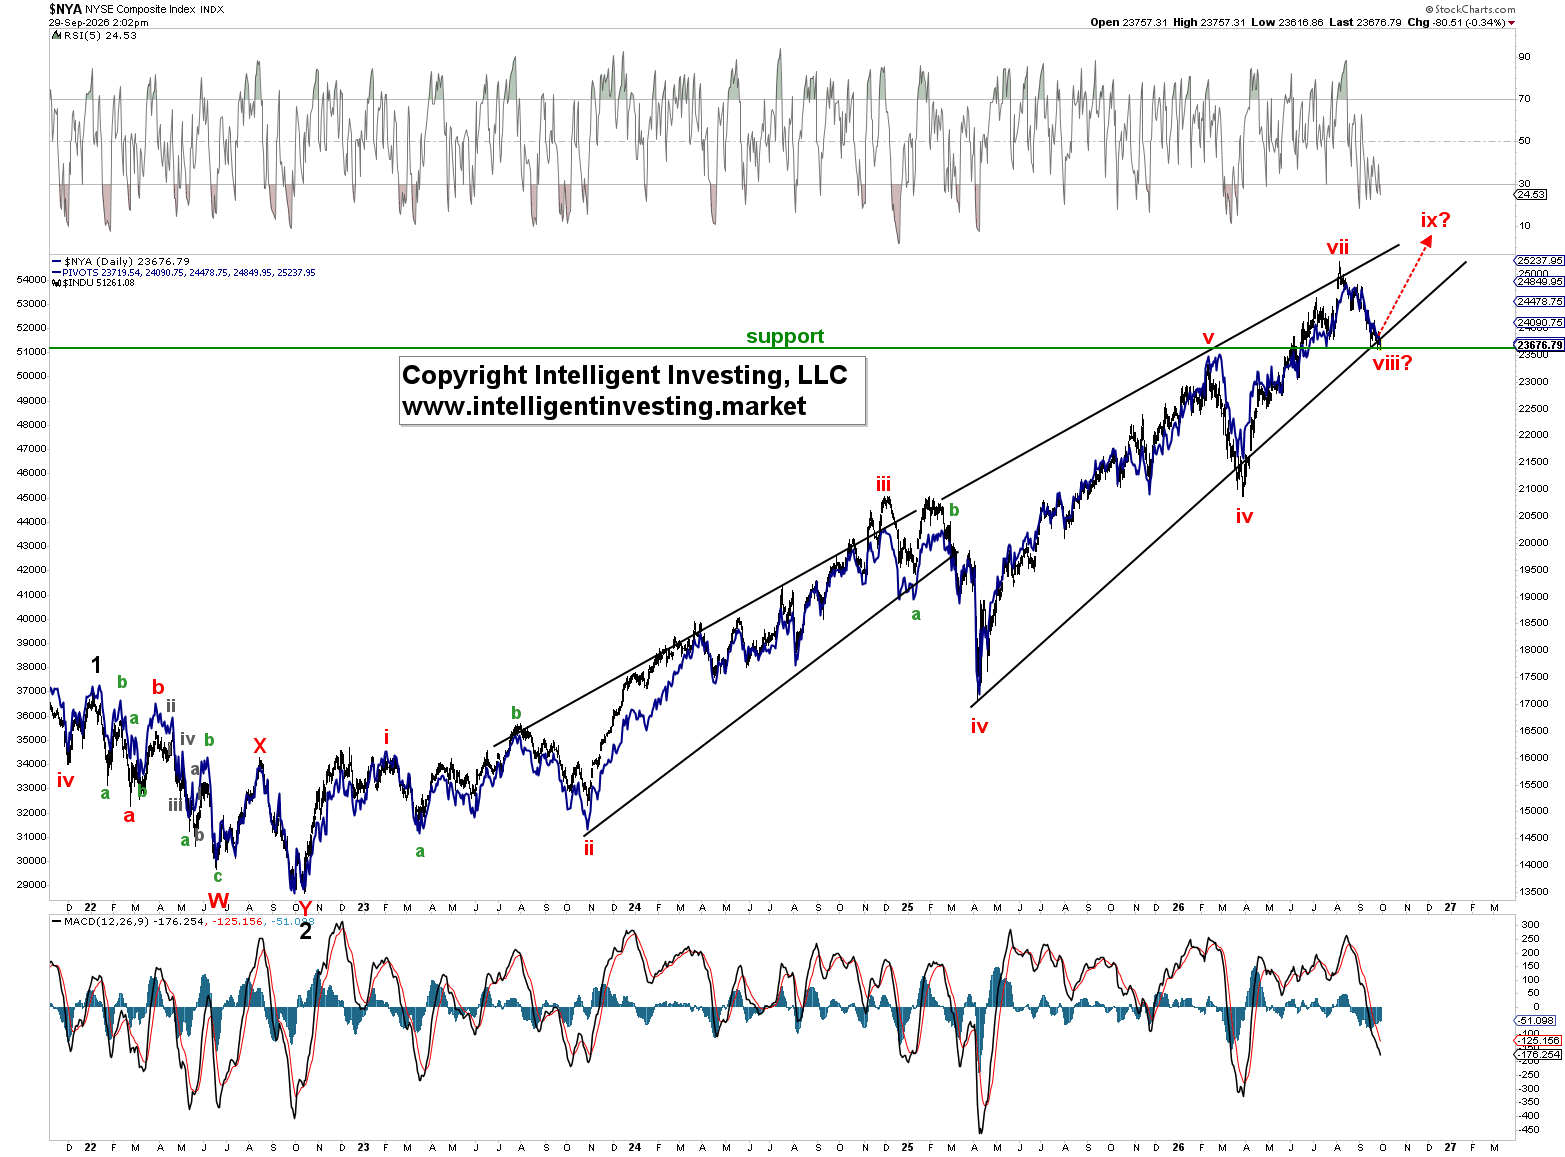
In addition, the NYSE (New York Stock Exchange Composite Index) has followed a similar pattern since the 2022 low, as has the Dow Jones. See Figure 2 below. Thus, as the NYSE goes, so fares the DJIA. When we assess the NYSE’s price action since that low, we find that another rally to new all-time highs is very possible because impulse waves move in 5, 9, or 13 waves, depending on how the 1st, 3rd, and 5th waves are subdivided. So far, we’ve only had 8 (red W-viii). So, instead of “only a bounce,” the DJIA may also rally to new ATHs.
Figure 2: NYSE (blue) and DOW (black) daily charts with our long-term Elliott wave count and several technical indicators
Another factor supporting a higher move soon is that NYSE’s market breadth is becoming extremely oversold. Its McClellan Oscillator (NYMO, a measure of how many stocks are advancing and declining) has been negative since mid-August, contributing to the current decline. Because it’s been negative for so long, its related Summation Index (NYSI) is now extremely oversold. See Figure 3 below.
Figure 2: NYMO (insert) and NYSI daily charts
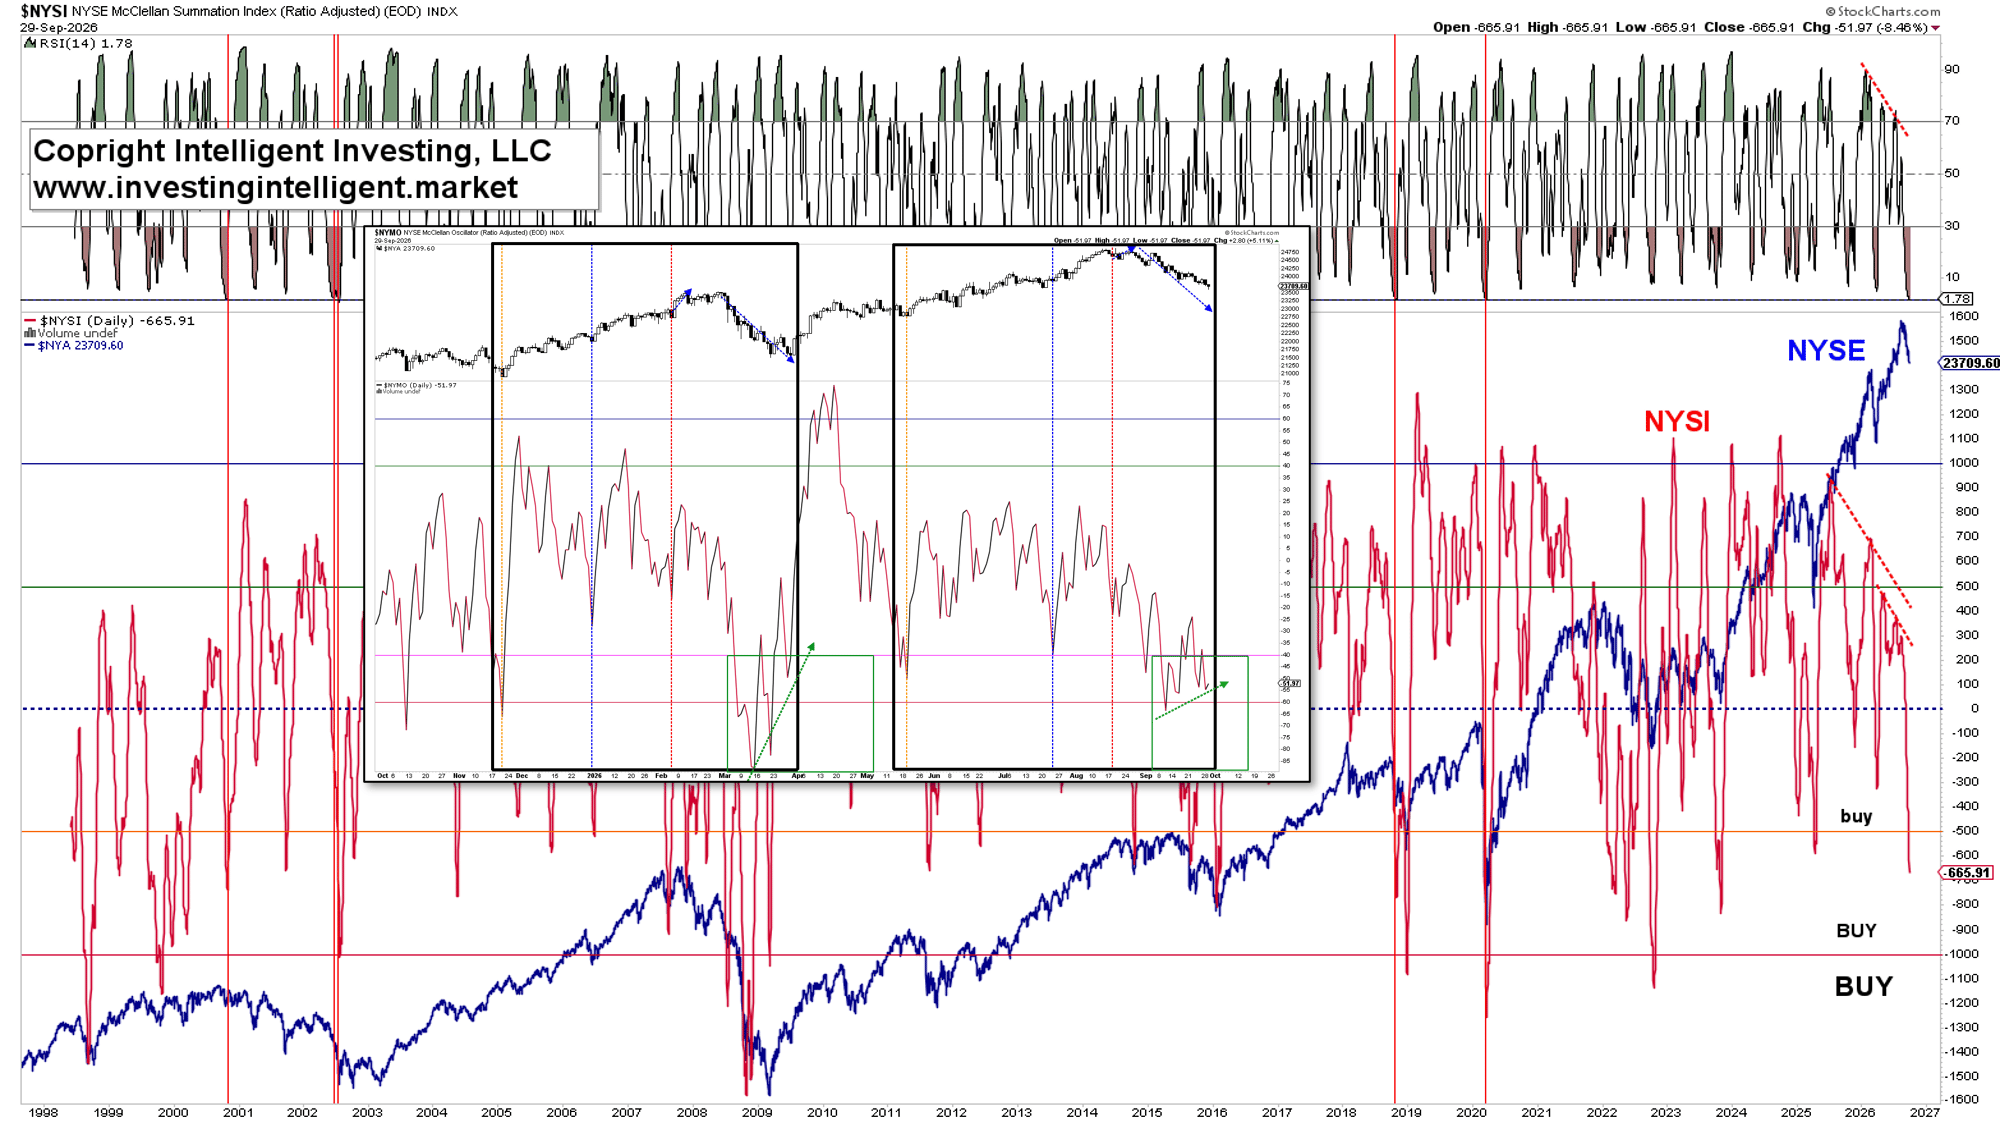
Specifically, the NYSI’s daily RSI5 stood at just 1.78 yesterday, while the indicator itself was at -665. These levels are rarely seen. The former has occurred only five times in its ~28-year history:
· Once in 2000 (on October 26; the index rallied ~5% before the next ~15% decline would start).
· Twice in 2002 (the first time was about 20 months after the 2000 top and when the index was already down ~23%).
· Once in 2018 (October 25, nine months after and ~10% below its peak made in early 2018. There was ~1.5% downside left until the October 29 low, followed by a 6.3% bounce),
· And during the COVID-19 crash (March 18: There was only ~6% downside left until the March 23 bottom).
Except for 2000, all were double-digit, multi-month to multi-year drawdowns, incomparable to what we are experiencing now. Meanwhile, the -665 reading ranks as the 2nd lowest since the 2022 bear market low. Thus, market internals are stretched far to the downside, while price is down only about 5-7% on these indexes, and even less for others, such as the S&P500 and NASDAQ.
Corrections can occur in price or time as the market sheds excess and overbought conditions before it can move higher again. But they can also happen internally. In this case, it appears the market is doing the latter. While many stocks are down significantly over the last month, the major indexes are holding up surprisingly well. Meanwhile, given that the NYSI has little room left for further downside and sits at levels akin to those seen in deep corrections and bear markets, it is likely time to issue the opposite warning as on August 6: a new rally is likely around the corner because when all the selling is done, only buying is left.
Author

Dr. Arnout Ter Schure
Intelligent Investing, LLC
After having worked for over ten years within the field of energy and the environment, Dr.
















