Dow Jones forecast: Elliott Wave points to 42.9K-47.3K fourth-wave low before final rally


The monthly chart of the Dow Jones Industrial Average (DJIA) continues to display a classic Elliott Wave Principle (EWP) progression that places the index firmly inside a larger-degree fourth wave within a massive Ending Diagonal (ED) that started at the COVID-19 crash low. In an ED, the 3rd wave tends to reach only the 123.60% to 138.20% extension of the 1st wave, measured from the 2nd wave low (black box). In this case, W-1 was the 2020-2022 rally, W-2 was the 2022 low, and W-3 most likely ended in August at 54,744, which is only 186 points (0.3%) above the 138.2% extension. See Chart 1 below.
Figure 1: Dow Jones Industrial Average preferred Elliott Wave count with technical indicators (StockCharts.com)
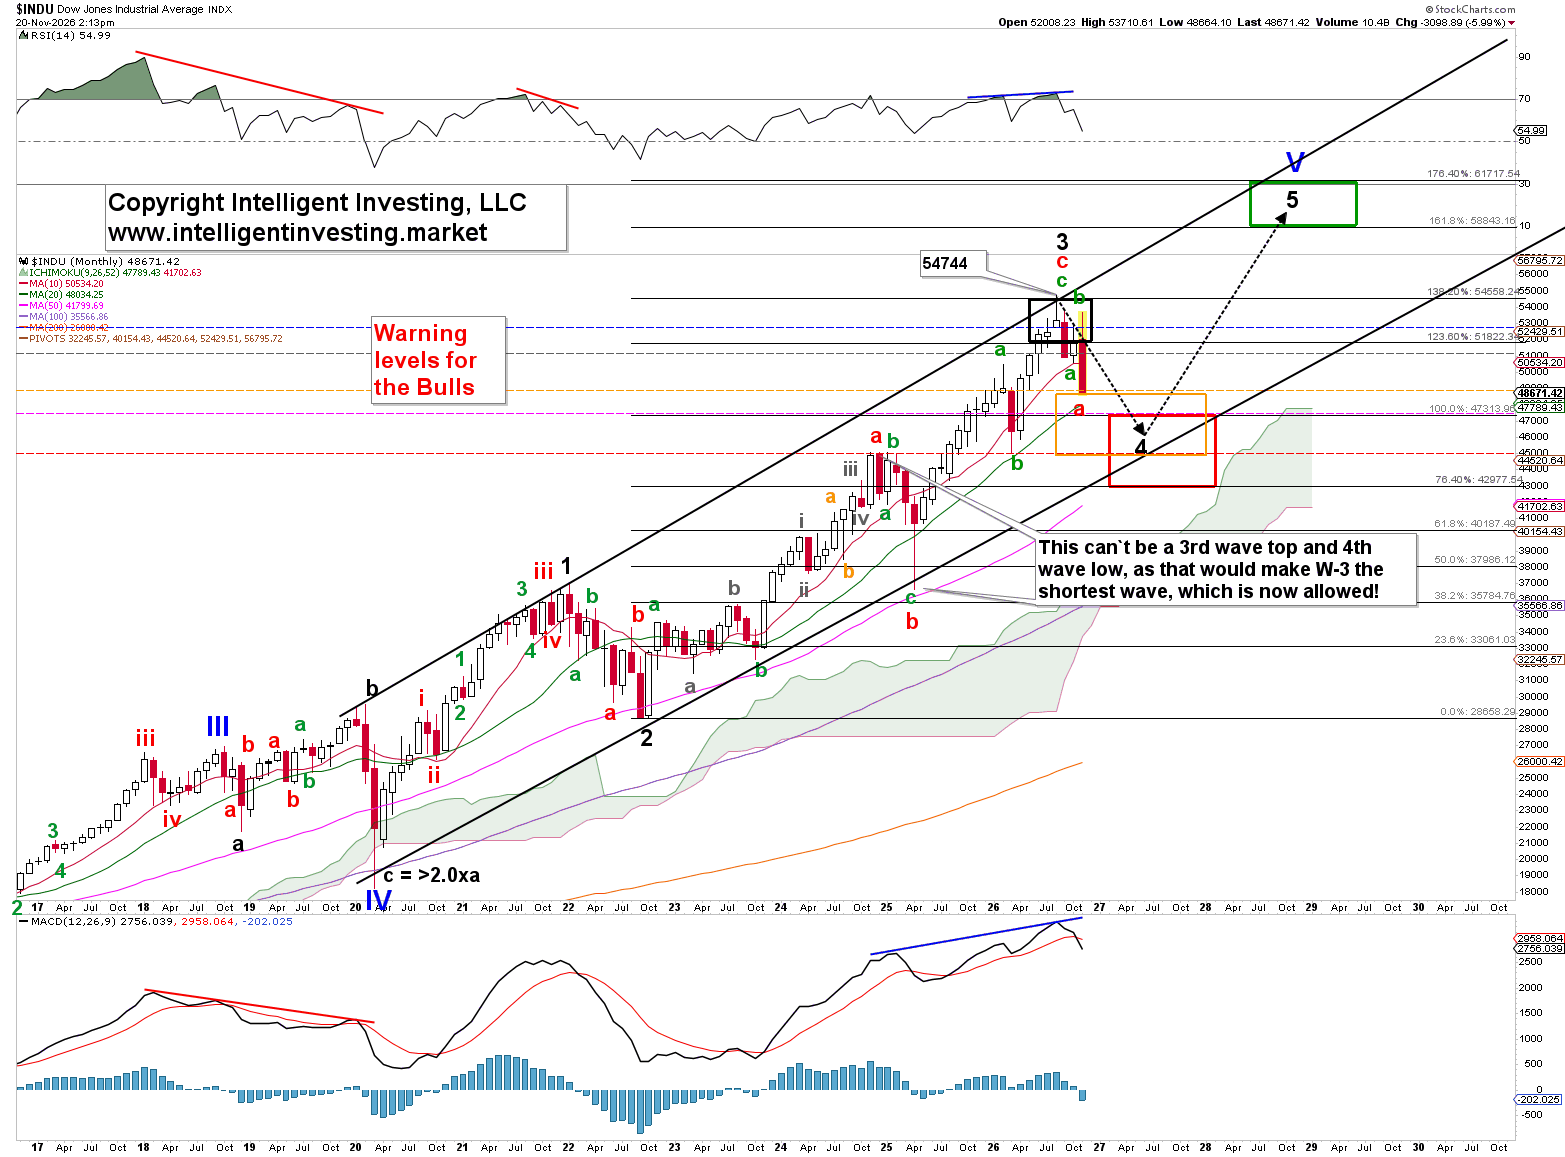
After the powerful third-wave advance that carried prices from the 2022 low through to the August 2026 high, the market has entered the expected corrective phase labeled as wave 4. In an ED, the 4th wave tends to bottom within the 76.4-100% Fibonacci zone (42.9-47.3K; red box), with an outside chance of reaching the 61.8% extension at ~$40.1K, from where the final 5th targets the 161.80-176.40% extension (58.8-61.7K; green box).
This fourth wave is unfolding within a well-defined rising channel. The channel's upper boundary guided the final stages of wave 3, while the lower boundary and intermediate Fibonacci retracement levels now form the primary support zone. The most recent price action is testing the vicinity of the 23.6% Fibonacci retracement of the prior W-3 (orange box), consistent with typical fourth-wave behavior, which often retraces a portion of the preceding third wave without invalidating the larger uptrend.
Strength (RSI) and Momentum (MACD) indicators support the corrective interpretation. The monthly RSI showed no negative divergences like in 2021 and 2018-2019. The MACD histogram has turned negative after a prolonged positive period, again without negative divergence (blue lines), confirming the loss of upside momentum that typically accompanies a fourth-wave consolidation.
On the chart, explicit “warning levels for the bulls” are highlighted. These warnings correspond to levels that have supported the advance over the last several months. If monthly closes remain above these zones, the third wave could continue, but we consider that unlikely. A decisive monthly close beneath the red warning level will confirm the fourth wave.
Within the current wave-4 structure, sub-waves a-b-c appear to be in progress, with the most recent decline looking like the latter stages of the dreaded corrective C-wave. Since the 2nd wave was a double zigzag that lasted 10 months, we expect the 4th wave to be either a triangle or a flat, based on the “rule of alternation,” and to last roughly as long. Once this fourth wave completes, the larger-degree count projects a fifth wave that should carry the Dow to new all-time highs, potentially testing the upper channel boundary and the higher Fibonacci extension targets marked on the chart.
Author
Dr. Arnout Ter Schure
Intelligent Investing, LLC
After having worked for over ten years within the field of energy and the environment, Dr.

















