|

Dow Futures (YM_F) looking for corrective rally soon [Video]

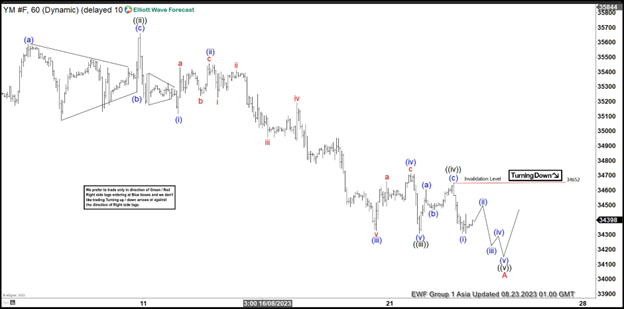
Short Term Elliott Wave view in Dow Futures (YM_F) suggests that cycle from 7.27.2023 high is mature and about to complete soon as 5 waves impulse. Down from 7.27.2023 high, wave ((i)) ended at 35076 and rally in wave ((ii)) ended at 35660. Index extended lower in wave ((iii)) as another impulse in lesser degree. Down from wave ((ii)), wave (i) ended at 35115 and rally in wave (ii) ended at 35456.

Dow Futures (YM_F) 60 minutes Elliott Wave chart
Dow Future

Index extended lower in wave (iii) towards 34328 and rally in wave (iv) ended at 34709. Final leg wave (v) ended at 34308 which completed wave ((iii)). Rally in wave ((iv)) ended at 34645 as a zigzag structure. Up from wave ((iii)), wave (a) ended at 34605, wave (b) ended at 34465, and wave (c) higher ended at 34645 which completed wave ((iv)). Down from wave ((iv)), wave (i) ended at 34307. Short term rally should fail in 3 or 7 swing against 34645 for further downside within wave ((v)). Once the 5 waves decline ends, it should complete wave A in larger degree. Then the Index should rally in wave B to correct decline from 7.27.2023 high in 3 or 7 swing before the decline resumes.

YM_F Elliott Wave video

Author

Elliott Wave Forecast Team

Elliott Wave Forecast Team

ElliottWave-Forecast.com

More from Elliott Wave Forecast Team
Share:

Editor's Picks

GBP/USD hits multi-week tops around 1.3560

GBP/USD gathers fresh steam and advances to new three-month peaks near the 1.3560 zone on Friday. Cable’s sharp move higher comes after three daily drops in a row and follows the increasing selling pressure hurting the Greenback.

EUR/USD pops to fresh two-month highs, targets 1.1600

EUR/USD advances markedly, revisiting the upper 1.1500s for the first time since mid-June. The pair’s sharp uptick comes on the back of a strong retracement in the US Dollar amid BoJ intervention chatter and despite steady uncertainty in the Middle East.

Gold retakes $4,400 as receding Fed hike bets undermine USD

Gold is looking to build on Friday's bounce from the $4,300 neighborhood as reduced bets on an immediate Fed rate hike keep US Dollar bulls on the defensive and support the non-yielding bullion. However, the US-Iran standoff could limit deeper USD losses, warranting caution before positioning for the resumption of the XAU/USD pair's recent uptrend to its highest level since June 5.

BTC/USD price outlook: Bitcoin navigating between arc levels. Potential continuation toward $58,000
Overview: Based on Arc Cycle Analysis applied to the 1D chart, Bitcoin is trading between the 0.5 Arc and 0.618 Arc within the current Arc Cycle. Price has cleared the 0.5 Arc and is progressing toward the 0.618 Arc, suggesting continued movement toward the next Arc boundary. Metric
 Weekly focus: Some relief in US inflation concerns

Actual inflation data for July came out as expected with a 0.1% m/m increase in headline CPI and 0.2% excluding food and energy. Annual headline inflation remains too high at 3.4% and means that wage earners are experiencing stagnating spending power at best, and core inflation is a bit higher than the inflation target of two percent would suggest.

Why is Crude Oil priced for a reopening the ships haven't made?
Fourteen vessels crossed the Strait of Hormuz on Tuesday. Before the war, the count ran near 120 a day. In the sessions since the waterway was publicly declared open, Brent has drifted back to $87 and West Texas Intermediate (WTI) to $81, both a little lower again on Wednesday, with daily momentum on each unwound from the top of its range in late July to the low twenties now.















