Does Alibaba have what it takes to rally 200% back to its all time high? [Video]
![Does Alibaba have what it takes to rally 200% back to its all time high? [Video]](https://editorial.fxstreet.com/images/Macroeconomics/Countries/Asia/China/shanghai-at-dusk-41696640.jpg)
Alibaba Group Holding Limited (BABA) is a multinational technology conglomerate that has footprints in e-commerce, retail, logistics, artificial intelligence, cloud computing and finance services. It provides an ecosystem that revolutionized the retail industry in China and globally with the adoption of various technologies.BABA is listed on NYSE as ADR.
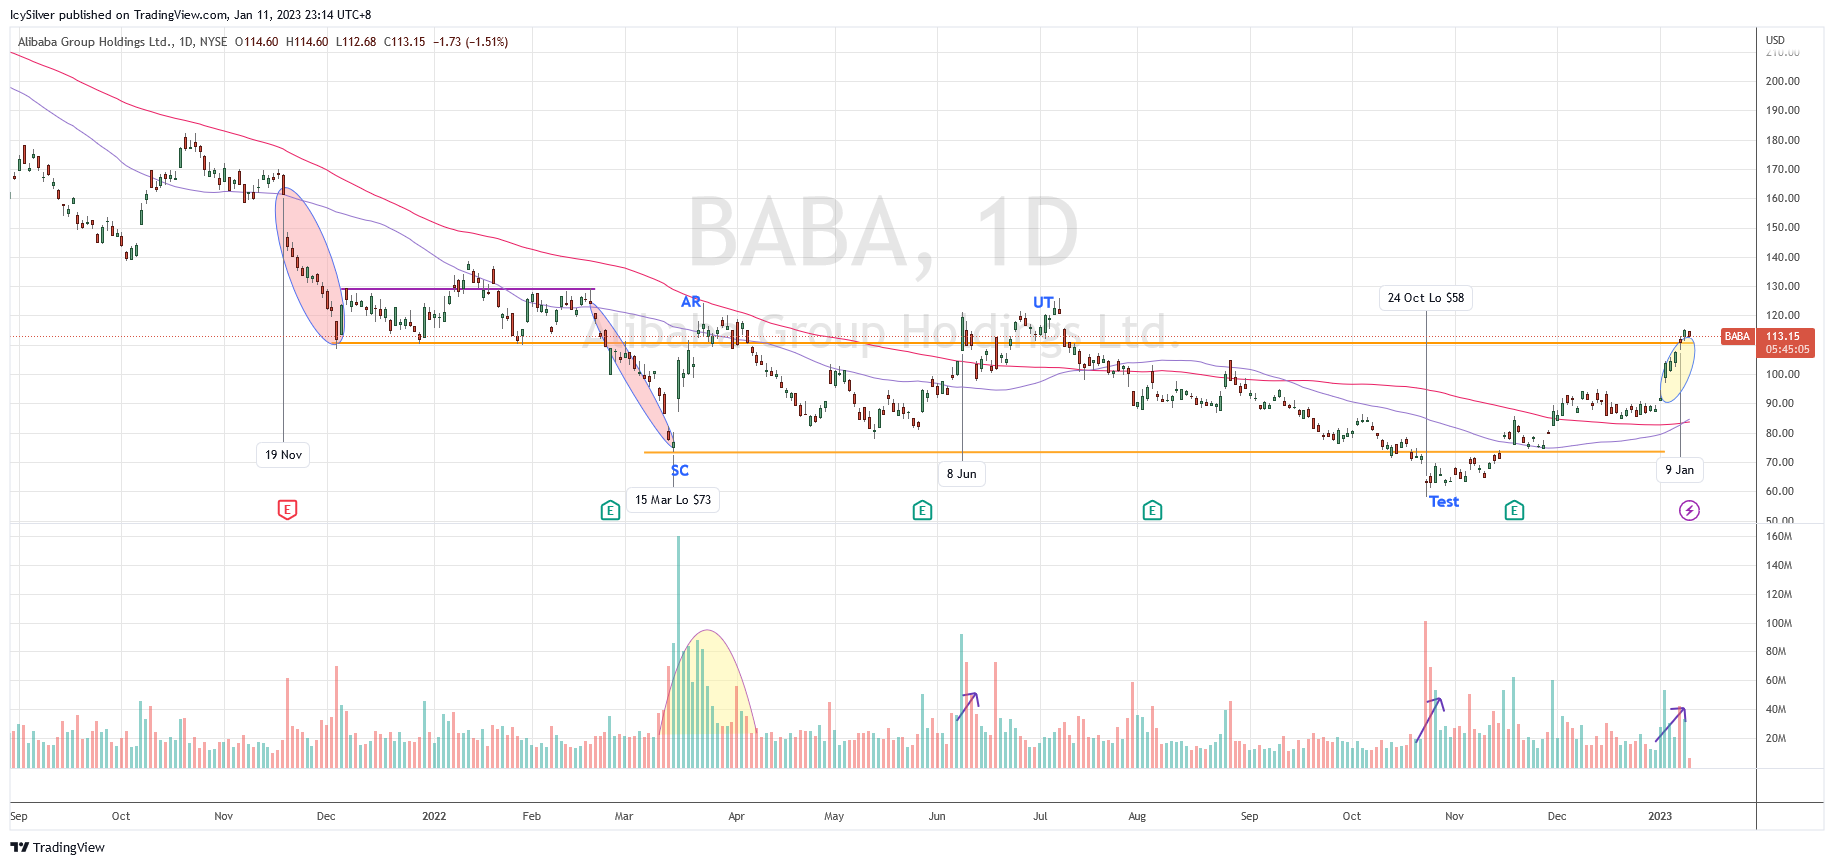
BABA has been in a clear down trend since Oct 2020. The earning results on 19 Nov 2021 triggered another round of Wyckoff sign of weakness (SOW) until the price found support at $110. However, the price was unable to rally up from there and turned into a Wyckoff redistribution phase. The price slided with increased volume to reach Wyckoff selling climax (SC) on 15 March 2022.
The subsequent months, BABA price moved sideways. It made several attempts to rally above the $110 axis. The price broke out on 8 June with increased volume but unable to follow through with an up swing. Instead it retraced back into the range, forming a Wyckoff upthrust (UT).
This was followed by grinding down action to test the $73 axis with relatively low volume. The spike of volume on 24 Oct and breaching the low to reach $58 is characteristic of the second point of fear. The following reaction was a gradual rally back into the range. The price rally with localized increase of volume suggesting presence of demand around 3 Jan 2023.
Bias
Slightly bullish. According to the Wyckoff method, BABA price is attempting to break the $110 axis with presence of demand. It would be prudent to observe the reaction to this price level. If the price is able to commit above $110 and form a Wyckoff backup, it will likely continue to rally up to next resistance around $124 followed by $140. The longer term target is at $180 and $200.
If the price pulls back into the range, it could retest to the midpoint of the range around $90 and spend more time in the range before attempting for breakout.
Recently some of the China theme stocks are showing signs of outperforming the indices. Find out how the Wyckoff method could help you find bullish stocks in the video below.
Author

Ming Jong Tey
Independent Analyst
Ming Jong Tey has been trading since 2008. He started his learning journey from technical analysis (indicators, Fibonacci, etc...) to value investing. Throughout his journey, he develops an interest in price action with chart pattern trading.