|

CSX Elliott Wave technical review [Video]

CSX Elliott Wave technical review

Function: Trend.

Mode: Impulsive.

Structure: Motive.

Position: Wave 3 of (1)

Direction: Upside in Wave 3.

Details: An impulsive structure is developing off the April lows, supporting the view of continued upside within Minor Wave 3. A top in wave {iii} may be approaching, with a subsequent pullback expected to reach around the $30 level.

Chart

CSX Elliott Wave technical review

Function: Trend.

Mode: Impulsive.

Structure: Motive.

Position: Wave (v) of {iii}.

Direction: Potential Top in Wave (v).

Details: The current move has reached the top of Minor Group 1 (MG1) at $33, indicating wave (v) of {iii} may be complete. A corrective phase into wave {iv} could now begin, with price potentially retracing to the $30 support zone.

Chart

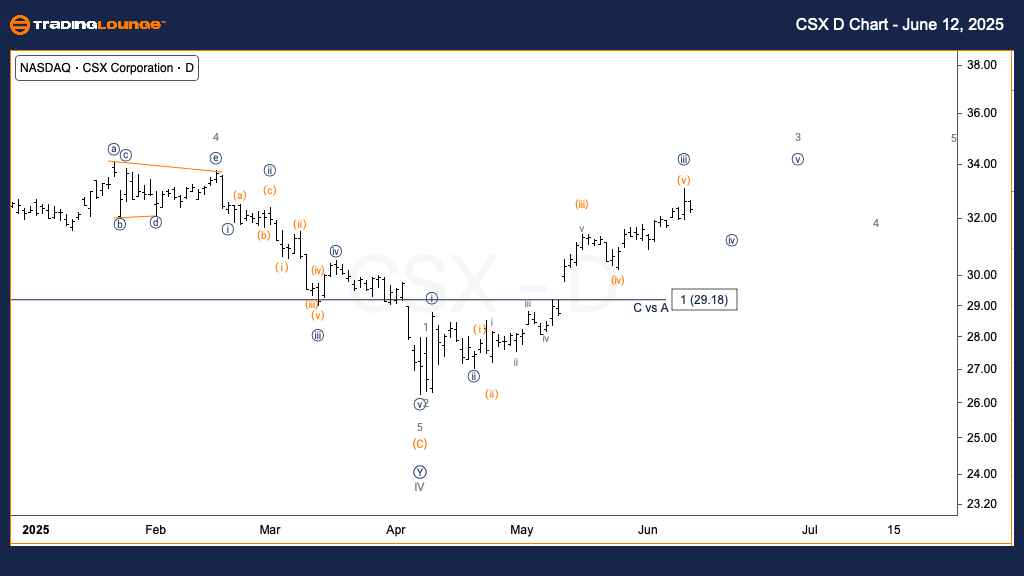
This analysis reviews CSX Corp. using Elliott Wave principles on the daily and 1-hour timeframes:

CSX is advancing within Minor Wave 3 of Primary Wave (1), originating from the April lows. The wave structure is impulsive, and a near-term high in wave {iii} is expected, followed by a corrective dip in wave {iv}. This pullback may test the $30 region, offering a potential re-entry zone aligned with the overall bullish trend.

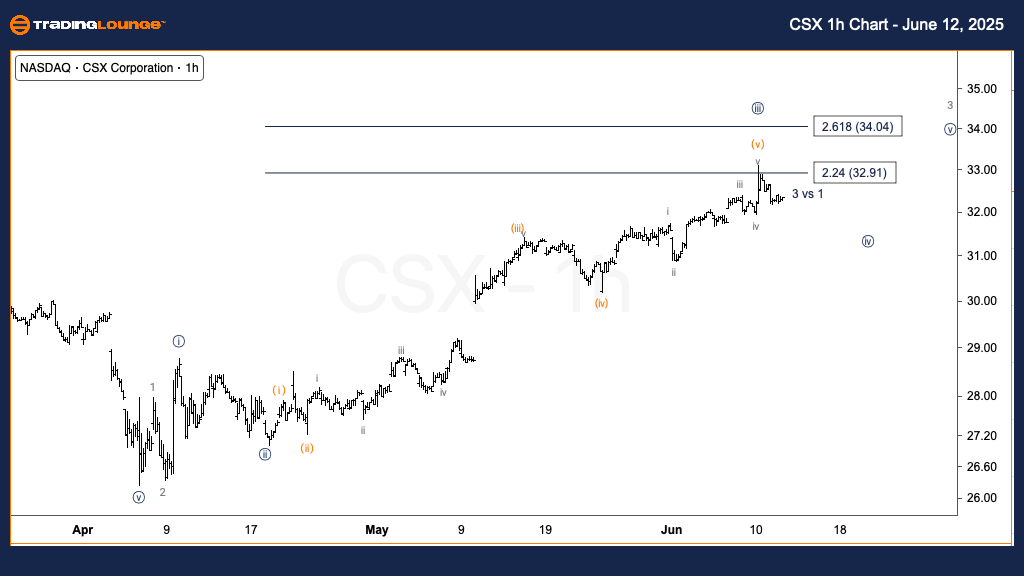
The intraday view shows a completed five-wave move into $33 at the top of MG1, marking a possible top in wave (v) of {iii}. The chart now favors a pullback phase in wave {iv}, targeting support near $30, in line with Fibonacci retracement levels.

CSX Elliott Wave technical review [Video]

Author

Peter Mathers

Peter Mathers

TradingLounge

Peter Mathers started actively trading in 1982. He began his career at Hoei and Shoin, a Japanese futures trading company.

More from Peter Mathers
Share:

Editor's Picks

EUR/USD tests nine-day EMA support near 1.1850

EUR/USD inches lower during the Asian hours on Monday, trading around 1.1870 at the time of writing. The 14-day Relative Strength Index momentum indicator at 56 stays above the midline, confirming improving momentum. RSI has cooled from prior overbought readings but stabilizes above 50, suggesting dips could stay limited before buyers reassert control.

GBP/USD flat lines as traders await key UK macro data and FOMC minutes

The GBP/USD pair kicks off a new week on a subdued note and oscillates in a narrow range, just below mid-1.3600s, during the Asian session. Moreover, the mixed fundamental backdrop warrants some caution for aggressive traders as the market focus now shifts to this week's important releases from the UK and the US.

Gold slides below $5,000 amid USD uptick and positive risk tone; downside seems limited

Gold attracts fresh sellers at the start of a new week and reverses a part of Friday's strong move up of over $150 from sub-$4,900 levels. The commodity slides back below the $5,000 psychological mark during the Asian session, though the downside potential seems limited amid a combination of supporting factors.

Bitcoin, Ethereum and Ripple consolidate within key ranges as selling pressure eases

Bitcoin and Ethereum prices have been trading sideways within key ranges following the massive correction. Meanwhile, XRP recovers slightly, breaking above the key resistance zone. The top three cryptocurrencies hint at a potential short-term recovery, with momentum indicators showing fading bearish signs.

Global inflation watch: Signs of cooling services inflation

Realized inflation landed close to expectations in January, as negative base effects weighed on the annual rates. Remaining sticky inflation is largely explained by services, while tariff-driven goods inflation remains limited even in the US.

Ripple Price Forecast: XRP potential bottom could be in sight

Ripple edges up above the intraday low of $1.35 at the time of writing on Friday amid mixed price actions across the crypto market. The remittance token failed to hold support at $1.40 the previous day, reflecting risk-off sentiment amid a decline in retail and institutional sentiment.