Crude Oil WTI Technical Analysis: Are oil bears going all in or is this bearish euphoria?

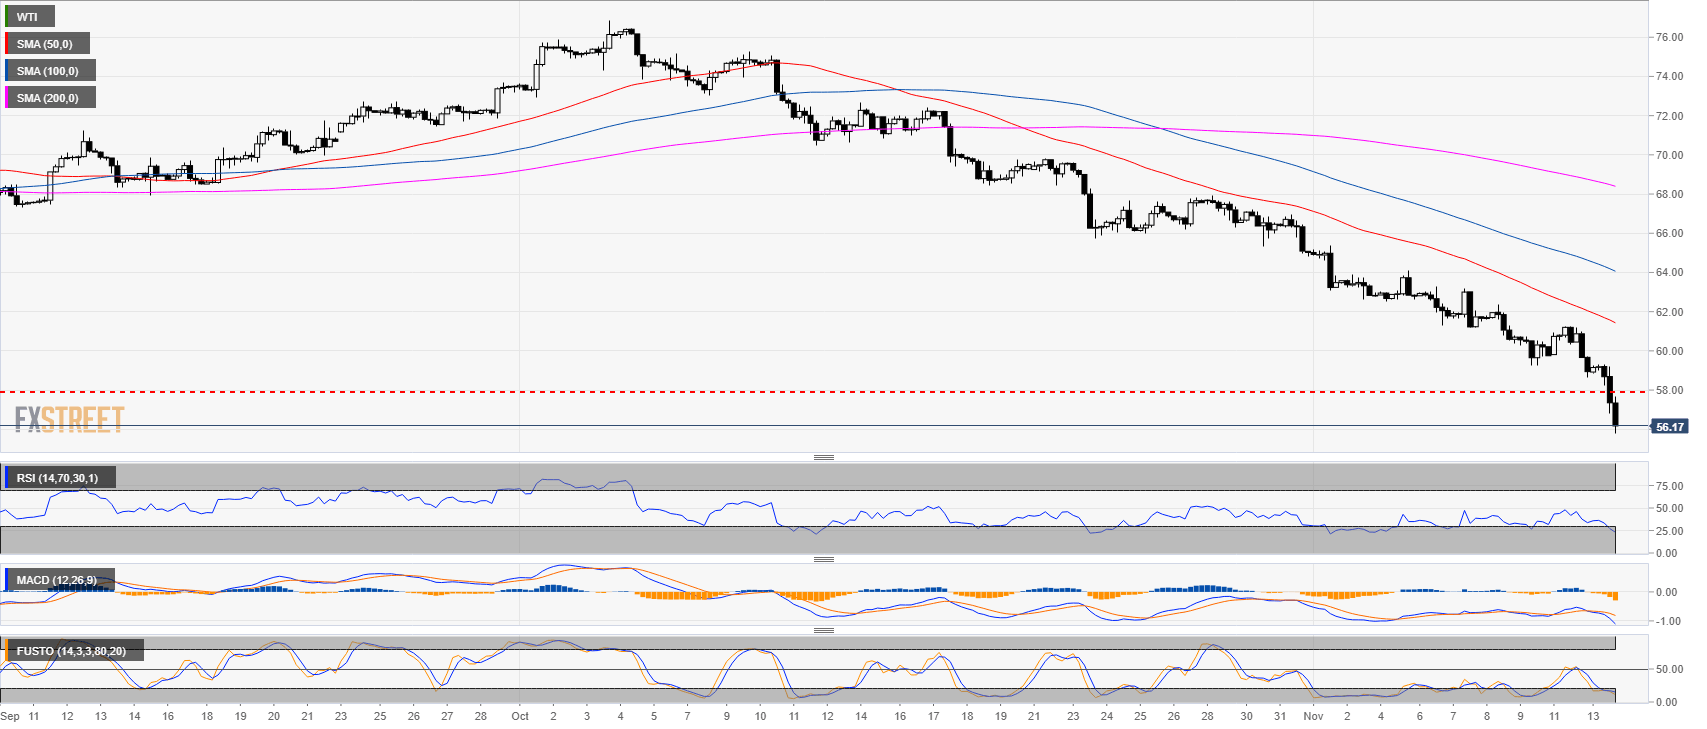
Crude oil weekly chart
-636777315773490846.png)
- Crude oil has reached a new 2018 low.
- It looks fairly ugly as the bears made heavy damage reversing the prior yearly gains in about 6 weeks.
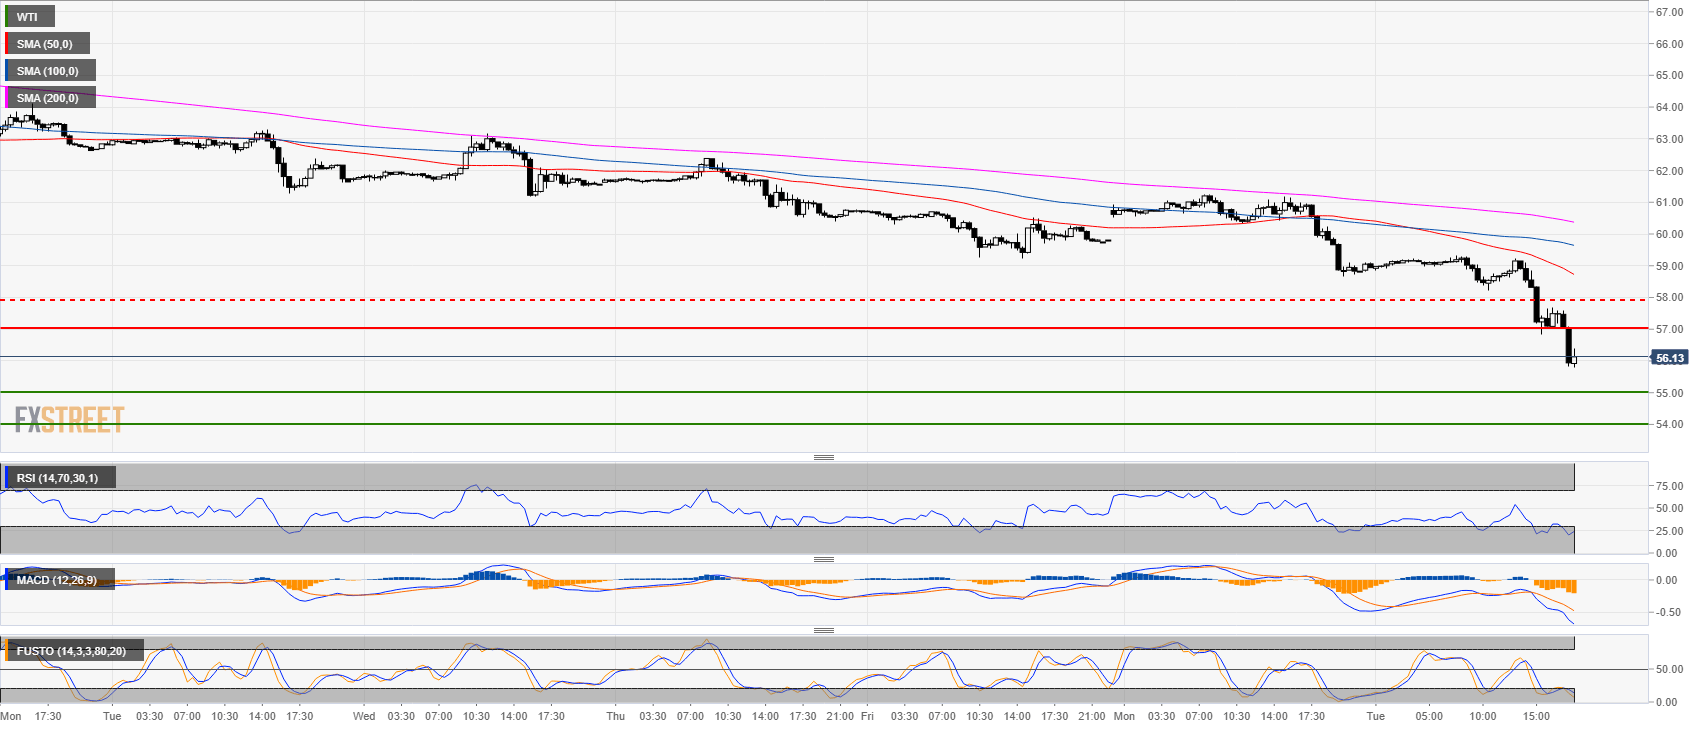
Crude oil 4-hour chart
- The selling is getting climactic signaling that bears might be getting ahead of themselves.
- However, the bear trend remains solidly in place.
Crude oil 30-minute chart
- Some profit-taking might lift oil towards $57.00 a barrel.
- However oil remains very fragile to any bearish incursions which can lead to 55.00 and 54.00 level.
Additional key levels at a glance:
WTI
Overview:
Last Price: 56.31
Daily change: -2.6e+2 pips
Daily change: -4.46%
Daily Open: 58.94
Trends:
Daily SMA20: 64.38
Daily SMA50: 69.02
Daily SMA100: 68.62
Daily SMA200: 68.45
Levels:
Daily High: 59.1
Daily Low: 58.83
Weekly High: 63.05
Weekly Low: 59.24
Monthly High: 76.25
Monthly Low: 64.86
Daily Fibonacci 38.2%: 59
Daily Fibonacci 61.8%: 58.93
Daily Pivot Point S1: 58.81
Daily Pivot Point S2: 58.69
Daily Pivot Point S3: 58.54
Daily Pivot Point R1: 59.08
Daily Pivot Point R2: 59.23
Daily Pivot Point R3: 59.35
Author

Flavio Tosti
Independent Analyst


