Comerica Inc: Navigating the weekly breakout

Comerica Incorporated (CMA) is a major financial services company headquartered in Dallas, Texas. CMA provides a wide array of products including commercial banking, wealth management, and retail services, making it a key barometer for the health of the middle-market business sector.
The long-term vision: Inverse head and shoulders
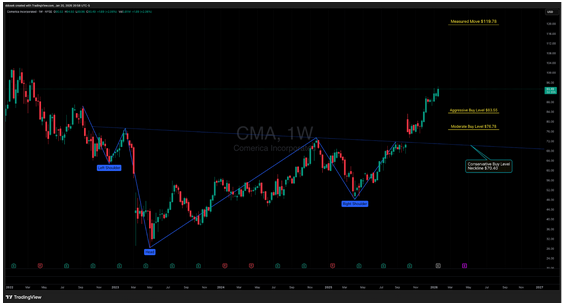
The primary story on the weekly chart is the completion of a massive Inverse Head and Shoulders (IH&S) pattern. This classic bottoming formation suggests that the multi-year downtrend has officially reversed.
By calculating the distance from the head to the neckline and projecting it upward from the breakout point, we arrive at a targeted measured move of $119.78. This target represents significant upside from current levels, provided the structural integrity of the chart remains intact.
Near-term caution: Overbought conditions
While the long-term target is compelling, the stock is currently overbought in the near-term. Following the recent vertical move, technical indicators suggest the price has extended too far, too fast. Chasing the breakout at these levels carries higher risk, as a period of consolidation or a "mean reversion" pull-back is likely needed to digest these gains.
Strategic buy levels
For investors looking to build or add to a position, the chart identifies three distinct entry zones based on risk tolerance:
- Aggressive Buy $83.55: This level is for those who believe the momentum is strong enough to bypass a deep correction.
- Moderate Buy $76.75: Situated slightly lower, providing a better risk-reward ratio by waiting for a partial retracement of the recent surge.
- Conservative Buy $70.40: This level aligns with the major support of the IH&S neckline. Waiting for this entry offers the highest margin of safety, as it tests the "polarity" of the previous resistance turning into support.
Author

Drew Dosek
Verified Investing
Passionate technical and cycle analyst committed to empowering traders through data-driven insights.

















