Cochlear Limited – COH Elliott Wave technical analysis [Video]
![Cochlear Limited – COH Elliott Wave technical analysis [Video]](https://editorial.fxsstatic.com/images/i/General-Stocks_1_XtraLarge.png)
Cochlear Limited - COH Elliott Wave Technical Analysis
Overview
Our updated Elliott Wave analysis for the Australian Stock Exchange (ASX) focuses on COCHLEAR LIMITED – COH. According to our forecast, ASX:COH may have finished a second wave correction and might be starting a third wave rally. This stage often brings more price gains. In this report, we outline the next price target, the invalidation level, and possible medium-term trend direction.
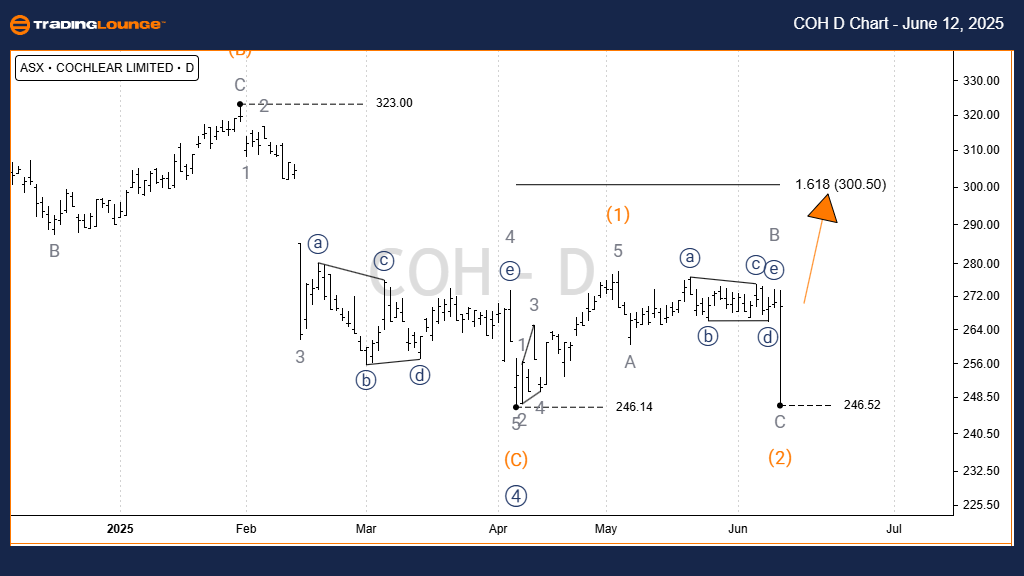
COH one-day chart (semilog scale) analysis
-
Trend: Intermediate (Orange).
-
Wave mode: Motive.
-
Wave structure: Impulse.
-
Wave position: Wave 5)) - navy.
Analysis details: Wave 4)) - navy likely just ended a correction pattern marked A,B,C) - orange. Now, it appears ready for Wave 5)) - navy to rise. This scenario supports a bullish market view, with the next potential target being the prior high from Wave 3)) - navy, near $350.00.
- Invalidation point: 246.52.
COH Elliott Wave technical analysis
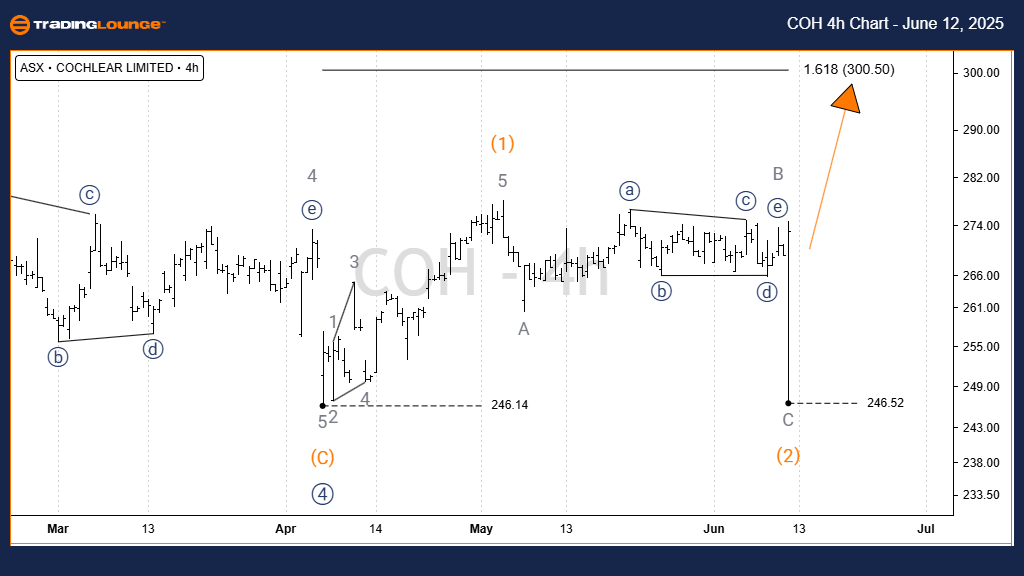
Four-hour chart analysis
-
Trend: Intermediate (orange).
-
Wave mode: Motive.
-
Wave structure: Impulse.
-
Wave position: Wave B - grey of Wave 2) - orange.
Short-term view: Recently, after forming a Diagonal pattern in Wave 1) - orange, COH saw a sharp drop in Wave 2) - orange, shaped as a Zigzag. This correction appears to have finished at 246.52 on a clear three-wave count. If this holds, Wave 3) - orange may now be beginning, targeting the short-term price level of 300.50 or higher.
- Invalidation point: 246.52
Conclusion
Our forecast aims to clarify the current Elliott Wave position of COCHLEAR LIMITED - COH. With well-defined price levels acting as confirmation or invalidation for the wave structure, our analysis helps traders build confidence in their strategy. The goal is to provide a neutral, professional outlook that supports smart trading decisions.
Cochlear Limited – COH Elliott Wave technical analysis [Video]
Author

Peter Mathers
TradingLounge
Peter Mathers started actively trading in 1982. He began his career at Hoei and Shoin, a Japanese futures trading company.


