Cisco Systems, Inc., commonly known as Cisco (CSCO), is an American-based multinational digital communications technology conglomerate corporation headquartered in San Jose, California. Cisco develops, manufactures, and sells networking hardware, software, telecommunications equipment and other high-technology services and products.
CSCO daily chart February 2023
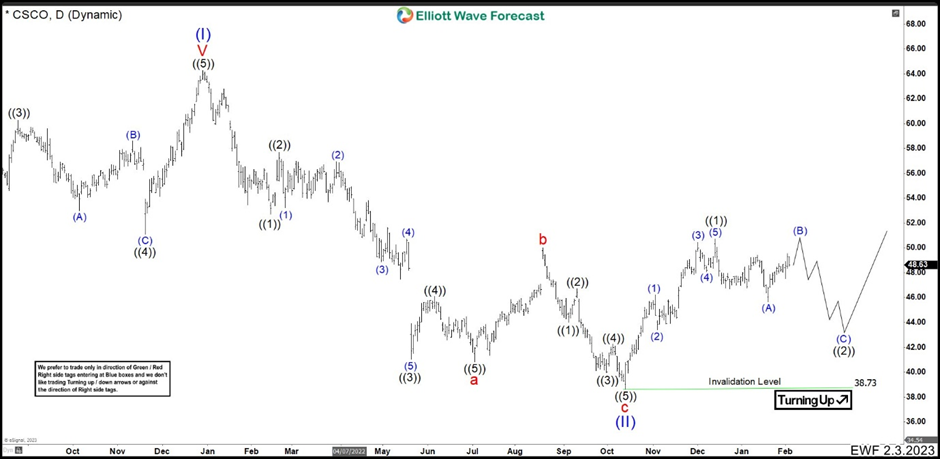
At the end of 2021, Cisco finished an impulsive structure at 64.33 which we called wave (I). From this high, CSCO has been down nearly a year. We can see a zig zag 5-3-5 structure. The first bearish impulse ended at $40.81 as wave a. Wave b bounced and ended at $50.05. To complete the corrective structure, we had another push that fell to $38.73 to end wave c and wave (II). Since October 2022 low, the stock has been moving to the upside reaching an important high in December. This high we call wave ((1)) and we were expecting to complete wave ((2)) before resuming the rally.
CSCO daily chart June 2023
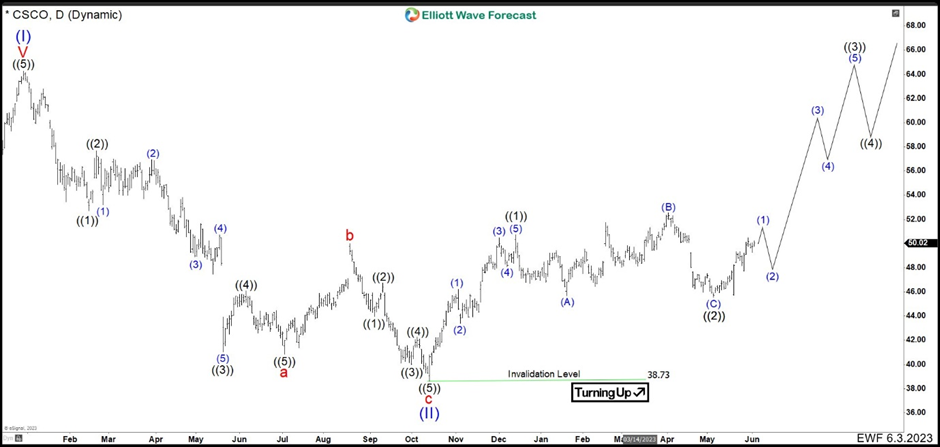
After ending wave ((1)) at $50.74, the market made an expanded flat as wave ((2)). We can see 3 swings lower to end Wave (A) of ((2)) at $45.65. Then, 3 swings higher as wave (B) ending at $52.60 and wave (C) impulse lower at $45.53. Completing a 3-3-5 flat structure and wave ((2)). CSCO continued the rally again and until now looks like is developing an impulse. While price action stays above $45.53 the rally should keep going to finish wave ((3)).
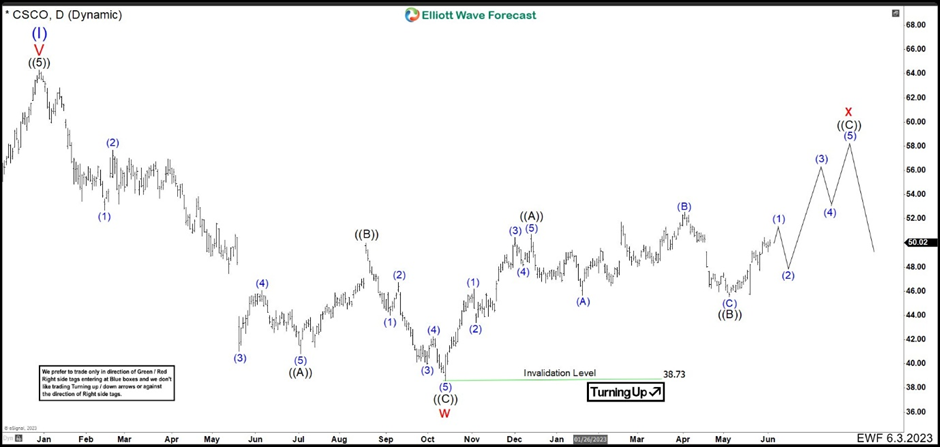
CSCO alternative daily chart June 2023
FURTHER DISCLOSURES AND DISCLAIMER CONCERNING RISK, RESPONSIBILITY AND LIABILITY Trading in the Foreign Exchange market is a challenging opportunity where above average returns are available for educated and experienced investors who are willing to take above average risk. However, before deciding to participate in Foreign Exchange (FX) trading, you should carefully consider your investment objectives, level of xperience and risk appetite. Do not invest or trade capital you cannot afford to lose. EME PROCESSING AND CONSULTING, LLC, THEIR REPRESENTATIVES, AND ANYONE WORKING FOR OR WITHIN WWW.ELLIOTTWAVE- FORECAST.COM is not responsible for any loss from any form of distributed advice, signal, analysis, or content. Again, we fully DISCLOSE to the Subscriber base that the Service as a whole, the individual Parties, Representatives, or owners shall not be liable to any and all Subscribers for any losses or damages as a result of any action taken by the Subscriber from any trade idea or signal posted on the website(s) distributed through any form of social-media, email, the website, and/or any other electronic, written, verbal, or future form of communication . All analysis, trading signals, trading recommendations, all charts, communicated interpretations of the wave counts, and all content from any media form produced by www.Elliottwave-forecast.com and/or the Representatives are solely the opinions and best efforts of the respective author(s). In general Forex instruments are highly leveraged, and traders can lose some or all of their initial margin funds. All content provided by www.Elliottwave-forecast.com is expressed in good faith and is intended to help Subscribers succeed in the marketplace, but it is never guaranteed. There is no “holy grail” to trading or forecasting the market and we are wrong sometimes like everyone else. Please understand and accept the risk involved when making any trading and/or investment decision. UNDERSTAND that all the content we provide is protected through copyright of EME PROCESSING AND CONSULTING, LLC. It is illegal to disseminate in any form of communication any part or all of our proprietary information without specific authorization. UNDERSTAND that you also agree to not allow persons that are not PAID SUBSCRIBERS to view any of the content not released publicly. IF YOU ARE FOUND TO BE IN VIOLATION OF THESE RESTRICTIONS you or your firm (as the Subscriber) will be charged fully with no discount for one year subscription to our Premium Plus Plan at $1,799.88 for EACH person or firm who received any of our content illegally through the respected intermediary’s (Subscriber in violation of terms) channel(s) of communication.
Recommended content
Editors’ Picks

AUD/USD: Gains capped by 0.6300 so far
AUD/USD succumbed to the selling pressure and receded to the 0.6230 zone after briefly piercing the key 0.6300 hurdle on the back of a choppy session in the US Dollar.

EUR/USD looks bid and near 1.0400
EUR/USD extended its weekly recovery and revisited the area above the 1.0400 level, although the move lacked follow through, with the pair eventually slipping back to the 1.0380 region in the wake of the closing bell on Wall Street.

Gold picks up pace above $2,900, Dollar weakens further
Extra selling bias in the Greenback now prompts Gold prices to regain the $2,900 mark per ounce troy and above despite the steady climb in US yields across the board.

Bitcoin and crypto recovers from CPI data as Trump pushes Russia–Ukraine diplomacy
Bitcoin and the crypto market saw slight gains on Wednesday after President Donald Trump's resolution calls with Russian President Vladimir Putin and Ukraine's President Volodymyr Zelenskyy.

How the European Union could counter US tariffs
With Trump ordering a 25% import tax on all steel and aluminium entering the US, trade tensions are inching closer to Europe. We take a closer look at how European policymakers could react. Spoiler alert: it's complicated.

The Best Brokers of the Year
SPONSORED Explore top-quality choices worldwide and locally. Compare key features like spreads, leverage, and platforms. Find the right broker for your needs, whether trading CFDs, Forex pairs like EUR/USD, or commodities like Gold.