Canadian Dollar lags on mixed Friday data prints
- The Canadian Dollar treaded water to wrap up the trading week.
- Canada saw a slight decline in home prices, Retail Sales meet expectations.
- Broad-market sentiment supports the Greenback, limiting Loonie options.

The Canadian Dollar (CAD) waffled into the midrange on Friday, testing into the low side but ultimately getting hamstrung as Canadian data comes in mixed and gets overshadowed by sentiment-bolstering US data prints.
Canada saw an unexpected contraction in its New Housing Price Index in October, a welcome sign for Canadians suffering under the weight of home prices that have outrun income for decades despite investors not being able to rely on forever-increasing home prices for investment returns. Headline Canadian Retail Sales came in at expectations, though core Retail Sales excluding automobile purchases accelerated in September.
Daily digest market movers: Canadian Dollar sticks to the midrange on mixed economic data
- Canada’s New Housing Price Index contracted by 0.4% MoM in October, down from the last print of a flat 0.0%, while investors were hoping for a 0.1% uptick. Despite the near-term downtick, Canada’s New Housing Price Index is still up 0.8% YoY.
- Canadian Retail Sales printed unchanged at 0.4% MoM in September, as markets expected.
- Core Canadian Retail Sales excluding automobile purchases lurched high to 0.9% MoM, walking back the previous month’s -0.8% contraction and stepping over the median market forecast of 0.5%.
- Market data reactions were fully absorbed by US Purchasing Managers Index (PMI) survey results that came in higher across the board, bolstering the US Dollar and limiting upside potential for the Loonie.
- It’s a quiet data docket on the cards for next week: Canada is almost entirely absent from the calendar schedule until next Friday’s Gross Domestic Product (GDP) update, with US GDP and Personal Consumption Expenditures Price Index (PCEPI) due on Wednesday.
Canadian Dollar price forecast
The Canadian Dollar (CAD) found a brief reprieve from Greenback strength this week, paring away recent losses and dragging the USD/CAD chart back below the 1.4000 handle. Despite a recovery in the Loonie’s stance, the pair remains close to recent highs as broad-market bids prop up the US Dollar.
USD/CAD is running the risk of rolling over into a fresh round of Canadian Dollar strength after bulls ran aground of a long-term sideways channel. However, near-term price action has yet to give up ground as bids battle it out well above the 50-day Exponential Moving Average (EMA) near 1.3830.
USD/CAD daily chart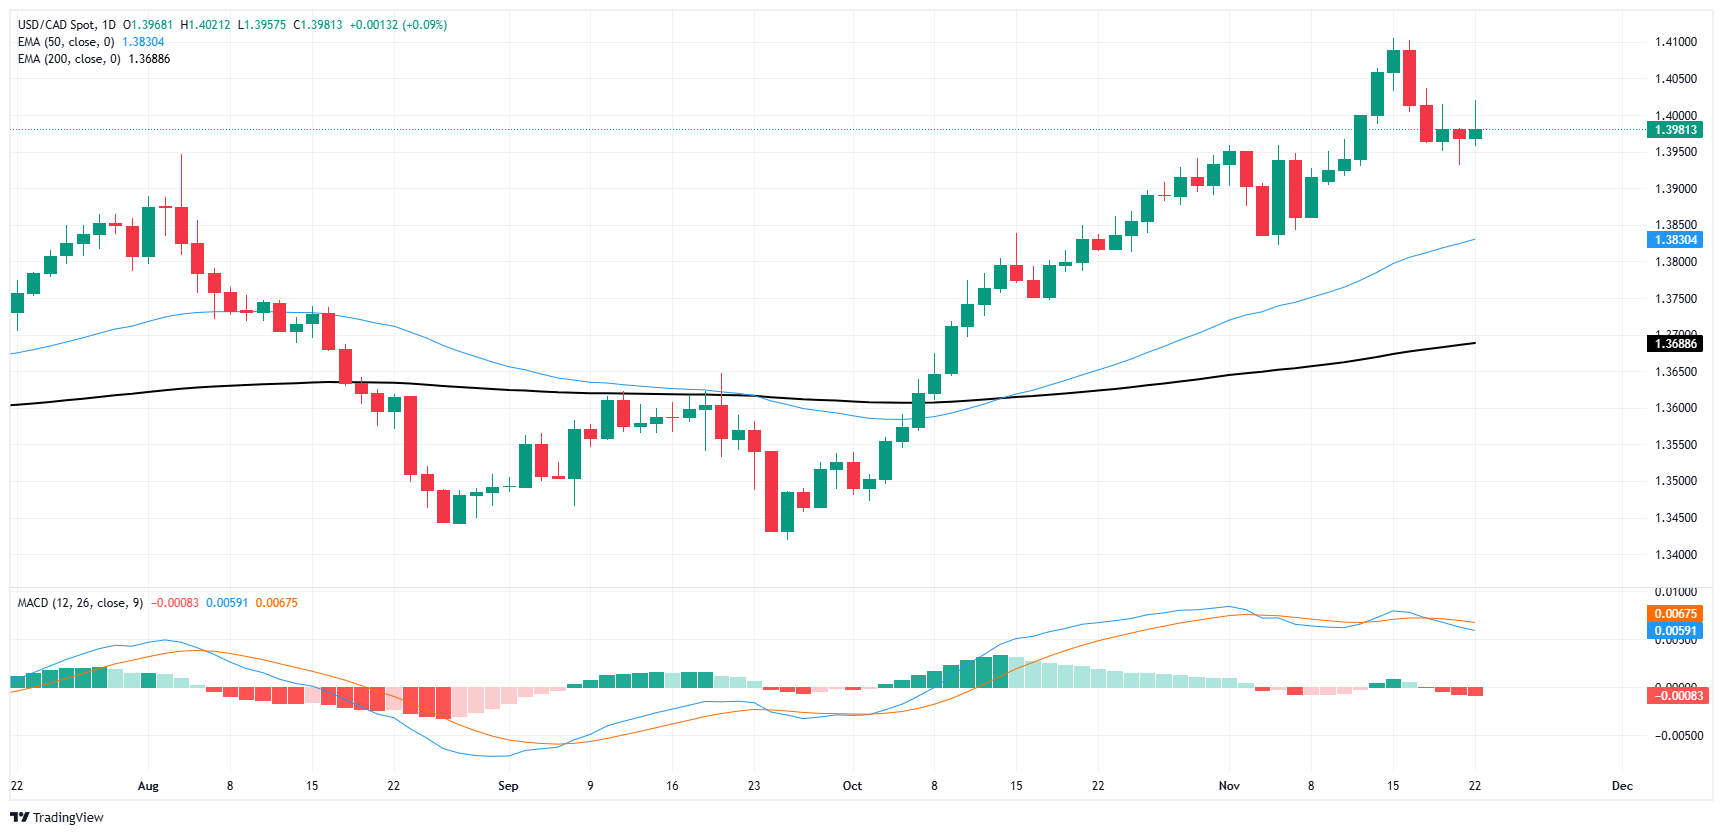
Economic Indicator
Retail Sales ex Autos (MoM)
The Retail Sales ex Auto data, released by Statistics Canada on a monthly basis, measures the total value of goods sold by retailers in Canada excluding the key sector of motor vehicles and parts. Changes in Retail Sales are widely followed as an indicator of consumer spending. Percent changes reflect the rate of changes in such sales, with the MoM reading comparing sales values in the reference month with the previous month. Generally, a high reading is seen as bullish for the Canadian Dollar (CAD), while a low reading is seen as bearish.
Read more.Last release: Fri Nov 22, 2024 13:30
Frequency: Monthly
Actual: 0.9%
Consensus: 0.5%
Previous: -0.7%
Source: Statistics Canada
Author

Joshua Gibson
FXStreet
Joshua joins the FXStreet team as an Economics and Finance double major from Vancouver Island University with twelve years' experience as an independent trader focusing on technical analysis.
















