British Pound underperforms despite upbeat UK flash PMI report
- The British Pound weakens even as UK flash S&P Global PMI data remains unexpectedly stronger in October.
- UK S&P Global Composite PMI arrives higher at 53.1 vs. 51.8 estimates.
- The BoE is highly expected to hike interest rates in November.

The British Pound (GBP) is down against its major currency peers on Friday, trading 0.1% lower at around 1.3380 against the US Dollar (USD) during the European trade. The British currency faces pressure even as United Kingdom (UK) flash S&P Global Purchasing Managers’ Index (PMI) data for October has come in surprisingly stronger.
Pound Sterling Price Today
The table below shows the percentage change of British Pound (GBP) against listed major currencies today. British Pound was the weakest against the Japanese Yen.
| USD | EUR | GBP | JPY | CAD | AUD | NZD | CHF | |
|---|---|---|---|---|---|---|---|---|
| USD | 0.14% | 0.14% | -0.06% | -0.04% | 0.03% | -0.07% | 0.27% | |
| EUR | -0.14% | 0.01% | -0.23% | -0.18% | -0.13% | -0.20% | 0.14% | |
| GBP | -0.14% | -0.01% | -0.23% | -0.17% | -0.13% | -0.21% | 0.12% | |
| JPY | 0.06% | 0.23% | 0.23% | 0.05% | 0.10% | 0.01% | 0.36% | |
| CAD | 0.04% | 0.18% | 0.17% | -0.05% | 0.07% | -0.04% | 0.31% | |
| AUD | -0.03% | 0.13% | 0.13% | -0.10% | -0.07% | -0.09% | 0.25% | |
| NZD | 0.07% | 0.20% | 0.21% | -0.01% | 0.04% | 0.09% | 0.34% | |
| CHF | -0.27% | -0.14% | -0.12% | -0.36% | -0.31% | -0.25% | -0.34% |
The heat map shows percentage changes of major currencies against each other. The base currency is picked from the left column, while the quote currency is picked from the top row. For example, if you pick the British Pound from the left column and move along the horizontal line to the US Dollar, the percentage change displayed in the box will represent GBP (base)/USD (quote).
The PMI report showed that the overall business activity remained robust due to a significant growth in both manufacturing and the service sector output. The Composite PMI arrives at 53.1, significantly higher than final reading of 52.0 in September. The data was expected to come in lower at 51.8.
“The UK economy has picked up momentum in October, with early PMI data indicating the strongest rate of growth since February. This encouraging sign of economic resilience is underscored by firms taking on additional workers for the first time since hiring was hit by the 2024 Autumn Budget,” Chris Williamson, Chief Business Economist at S&P Global Market Intelligence.
Earlier in the day, UK Retail Sales came in weaker-than-projected. The Office for National Statistics (ONS) reported that Retail Sales declined 0.4% Month-on-Month (MoM) in September. The data was already expected to decline but at a moderate pace of 0.1%.
On the monetary policy front, the Bank of England (BoE) seems almost certain to hike interest rates in the November policy meeting.
BoE seen turning more hawkish as UK inflation and wages surprise to the upside
Strategists at Societe Generale argue that a BoE rate increase is effectively “nailed on in November,” pointing to a “brace of upside surprises for CPI and PPI output price inflation, and firmer wage data” as key drivers. They warn that this combination will “alert the MPC to the budding risk of second round effects” and “will almost certainly trigger a hawkish response on interest rates” at the next policy meeting in two weeks.
Meanwhile, the US Dollar snaps four-day losing streak and rebounds while going into the weekend. Investors keenly await the preliminary United States (US) S&P Global PMI data for October, which will be published ay 13:45 GMT.
GBP/USD Technical Analysis
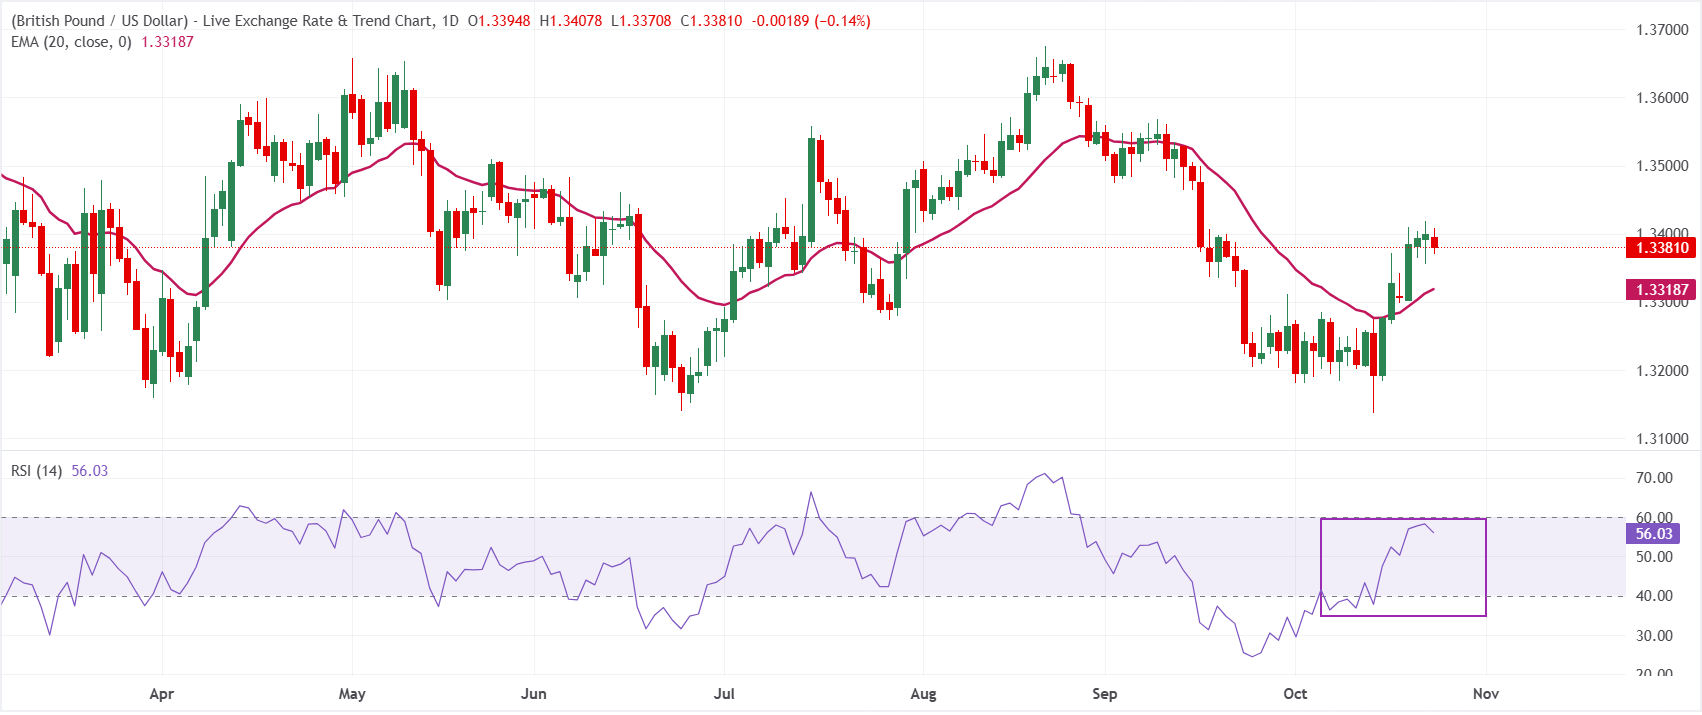
In the daily chart, GBP/USD trades at 1.3381. The pair holds above the 20-period exponential moving average (EMA) at 1.3319, which underpins a mildly bullish near-term bias as price extends its recovery away from the recent lows. The Relative Strength Index (RSI) at 56 stays in positive territory without being overbought, suggesting steady upside momentum rather than an exhausted rally.
On the downside, immediate support is seen at the current pivot area around 1.3381, with stronger underlying demand coming from the 20-period EMA at 1.3319, which reinforces the broader recovery structure as long as it remains intact. With no nearby technical resistance levels in the dataset, the pair would likely continue probing higher while these supports hold, although a sustained break back below 1.3319 would hint at fading bullish pressure.
(The technical analysis of this story was written with the help of an AI tool. Know more.)
Economic Indicator
S&P Global Composite PMI
The Composite Purchasing Managers Index (PMI), released on a monthly basis by S&P Global, is a leading indicator gauging private-business activity in UK for both the manufacturing and services sectors. The data is derived from surveys to senior executives. Each response is weighted according to the size of the company and its contribution to total manufacturing or services output accounted for by the sub-sector to which that company belongs. Survey responses reflect the change, if any, in the current month compared to the previous month and can anticipate changing trends in official data series such as Gross Domestic Product (GDP), industrial production, employment and inflation.The index varies between 0 and 100, with levels of 50.0 signaling no change over the previous month. A reading above 50 indicates that the UK private economy is generally expanding, a bullish sign for the Pound Sterling (GBP). Meanwhile, a reading below 50 signals that activity is generally declining, which is seen as bearish for GBP.
Read more.Last release: Fri Oct 23, 2026 08:30 (Prel)
Frequency: Monthly
Actual: 53.1
Consensus: 51.8
Previous: 52
Source: S&P Global
Author

Sagar Dua
FXStreet
Sagar Dua is associated with the financial markets from his college days. Along with pursuing post-graduation in Commerce in 2014, he started his markets training with chart analysis.