British Pound buckles as US yields rise puts Fed in command
- GBP/USD tests five-week lows as US Treasury yields surge.
- Fed hike odds hit 93%, strengthening the US Dollar’s policy edge.
- UK jobs data and FOMC decision drive next Sterling move.

The British Pound (GBP/USD) tested five-week lows of 1.3464 and trimmed some of its earlier losses on Monday, but it remains in the red, down 0.23% amid a light economic docket in the US and the UK as both countries' central banks get ready to release their monetary policy decisions on Wednesday and Thursday, respectively. At the time of writing, GBP/USD trades at 1.3492.
Sterling slips as Fed-BoE policy divergence favours the Dollar
Investors' mood is neutral after beginning the week on the back foot, as Oil prices surged, driven by Houthi attacks on Saudi Arabia that damaged the East-West pipeline, which bypassed the closure of the Strait of Hormuz by routing through the Red Sea.
According to the kingdom's statement, they decided to take precautionary measures by shutting down the pipeline, which has a capacity of around 7 million barrels per day.
Last week, US inflation figures, along with fears of potential Oil supply disruption, pushed the US 10-year T-note yield past the 5% threshold for the first time since 2023. The US Dollar Index (DXY), which tracks the buck’s performance against six currencies, is up 0.39% at 99.47.
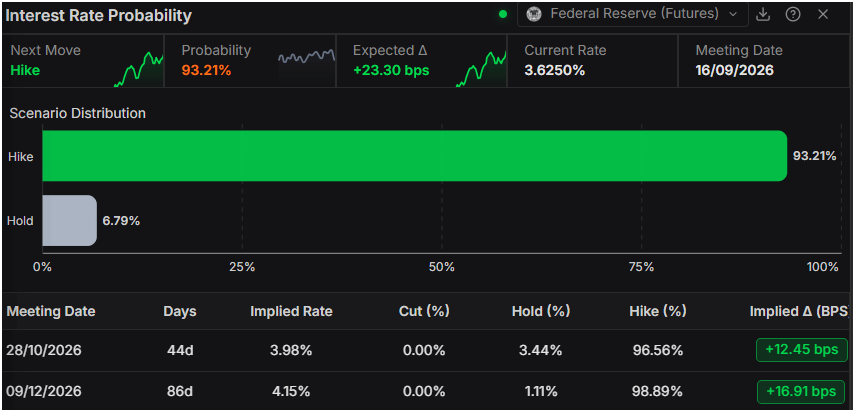
This increased bets that the Fed will increase rates on Wednesday from 3.50%-3.75% to 3.75%-4%, a tailwind for the Greenback. Prime Terminal sees a 93% chance of a hike, with a minimal 7% chance of holding rates unchanged.
Conversely, the Bank of England (BoE) is expected to keep the Bank Rate at 3.75% after last week’s GDP figures, which showed the economy grew by 0.3% in July, exceeding most economists' forecasts.
Hence, the widening interest rate differential puts the US Dollar in the front seat, paving the way for further downside in GBP/USD. Since peaking last week at around 1.3568, the pair has dipped to 1.3492 as of writing, down by over 0.56%.
Ahead, the UK economic docket will feature jobs data on Tuesday. In the US, the ADP Employment Change 4-week average is expected, ahead of Wednesday's FOMC policy decision.
GBP/USD Price Forecast: Technical outlook
In the daily chart, GBP/USD trades at 1.3492. The pair holds above the latest simple moving average triple at 1.3481 and the short-term rising support trend line coming in around 1.3472, which together suggest a mildly bullish near-term bias while price stays supported above this cluster. Additional underlying demand is hinted by former resistance lines now tracking near 1.3461 and 1.3353, though the Relative Strength Index (14) around 45 keeps momentum tone neutral rather than strongly directional.
On the downside, initial support is seen at the 1.3492 area, followed by the nearby technical floor defined by the simple moving average triple at 1.3481 and the upward-sloping trend line at 1.3472, ahead of deeper support at 1.3461 and 1.3353. On the topside, the next significant hurdle is the higher support trendline break price now acting as resistance around 1.3688, and a daily close above this level would be needed to extend the broader advance.
(The technical analysis of this story was written with the help of an AI tool. Know more.)
Pound Sterling Price Today
The table below shows the percentage change of British Pound (GBP) against listed major currencies today. British Pound was the strongest against the New Zealand Dollar.
| USD | EUR | GBP | JPY | CAD | AUD | NZD | CHF | |
|---|---|---|---|---|---|---|---|---|
| USD | 0.32% | 0.13% | 0.49% | 0.23% | 0.32% | 0.45% | -0.06% | |
| EUR | -0.32% | -0.16% | 0.14% | -0.12% | 0.00% | 0.13% | -0.38% | |
| GBP | -0.13% | 0.16% | 0.29% | 0.07% | 0.17% | 0.30% | -0.28% | |
| JPY | -0.49% | -0.14% | -0.29% | -0.26% | -0.14% | -0.04% | -0.58% | |
| CAD | -0.23% | 0.12% | -0.07% | 0.26% | 0.08% | 0.20% | -0.35% | |
| AUD | -0.32% | -0.00% | -0.17% | 0.14% | -0.08% | 0.13% | -0.47% | |
| NZD | -0.45% | -0.13% | -0.30% | 0.04% | -0.20% | -0.13% | -0.58% | |
| CHF | 0.06% | 0.38% | 0.28% | 0.58% | 0.35% | 0.47% | 0.58% |
The heat map shows percentage changes of major currencies against each other. The base currency is picked from the left column, while the quote currency is picked from the top row. For example, if you pick the British Pound from the left column and move along the horizontal line to the US Dollar, the percentage change displayed in the box will represent GBP (base)/USD (quote).
Author

Christian Borjon Valencia
FXStreet
Markets analyst, news editor, and trading instructor with over 14 years of experience across FX, commodities, US equity indices, and global macro markets.

















