Bitcoin Price Forecast: BTC extends recovery as optimism grows around US-Iran deal
- Bitcoin extends its mild recovery on Thursday as optimism surrounding a potential US-Iran peace deal improves market sentiment.
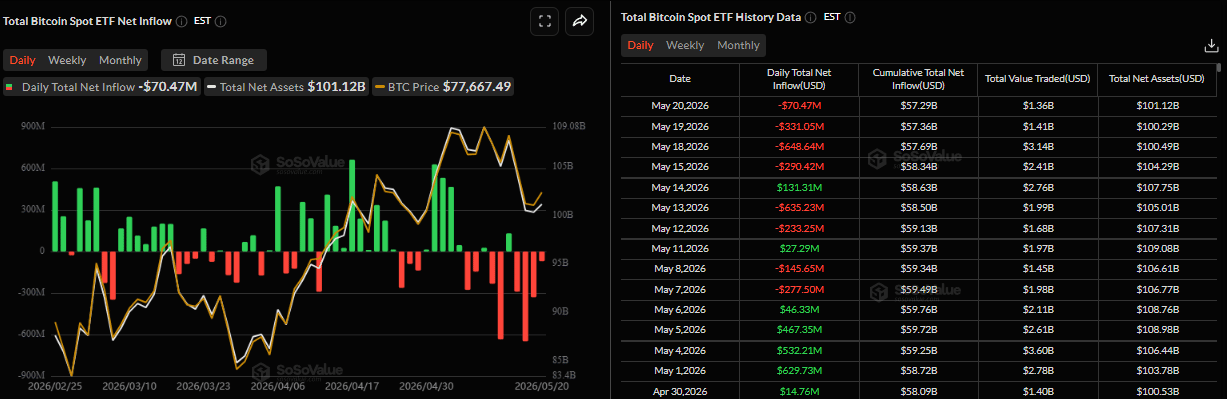
- Spot Bitcoin ETFs continue to record steady outflows so far this week, posting a fourth consecutive day of withdrawals.
- On-chain analysis signals weakening demand, with overall market activity shifting into net contraction.

Bitcoin (BTC) extends its recovery, trading above $77,500 on Thursday amid optimism over a potential US-Iran peace deal that is supporting the market's risk-on sentiment. Despite this rebound, spot Exchange Traded Funds (ETFs) continue to record steady outflows, and on-chain data highlights cautious signs, with net demand for the Crypto King contracting.
US-Iran peace hopes lift risk appetite
Risk sentiment among market participants is improving after news on Wednesday that US President Donald Trump characterized the ongoing negotiations with Iran as in their final stages. However, President Trump also reiterated a firm pledge to resume military actions within days if Iran rejects his terms.
In response, Iranian President Masoud Pezeshkian said that Tehran has no intention of capitulating, stating on the social media platform X that attempting to force a surrender through coercion is "nothing more than an illusion".
ETF outflows continue
Despite a mild price recovery, institutional demand for the Crypto King has continued to fade so far this week. SoSoValue data shows that US-listed spot BTC ETFs recorded an outflow of $70.47 million on Wednesday, marking the fourth consecutive day of withdrawals since last week. If this outflow trend persists and intensifies, BTC could resume its price fall.
On-chain perspective turns bearish
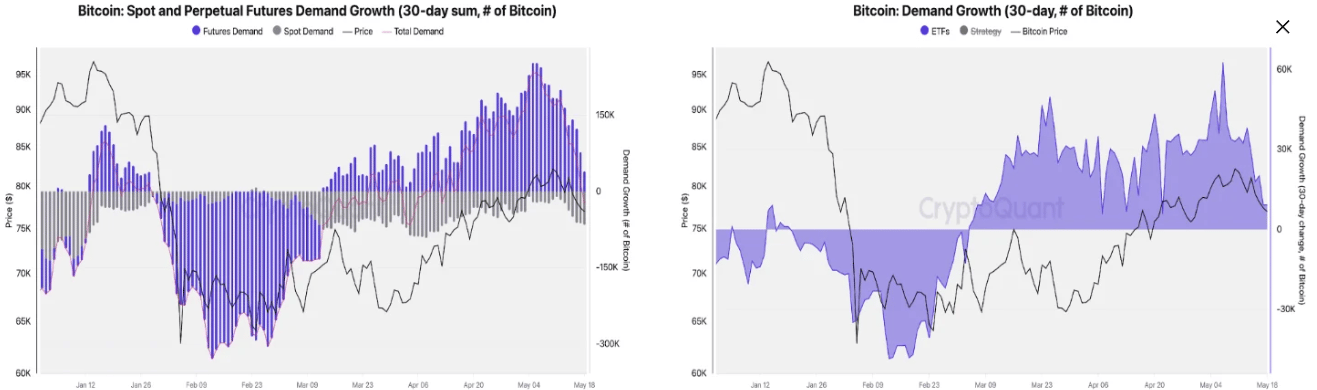
CryptoQuant’s weekly report highlighted that Bitcoin’s overall demand has flipped into net contraction.
As explained in the previous report, BTC’s April rally was mostly driven by perpetual futures demand. Currently, this driving force has reversed sharply after prices hit the key overhead supply zone around $82,000 in the previous week. This indicates that traders closed leveraged long positions, removing the marginal buying pressure that had sustained the upside move.
Looking deeper into the demand side, the analyst noted: “Spot apparent demand is now contracting at a slightly faster pace than in prior weeks. US-based spot ETFs also turned net sellers, with 30-day ETF demand growth falling to its lowest level in nearly a month.”
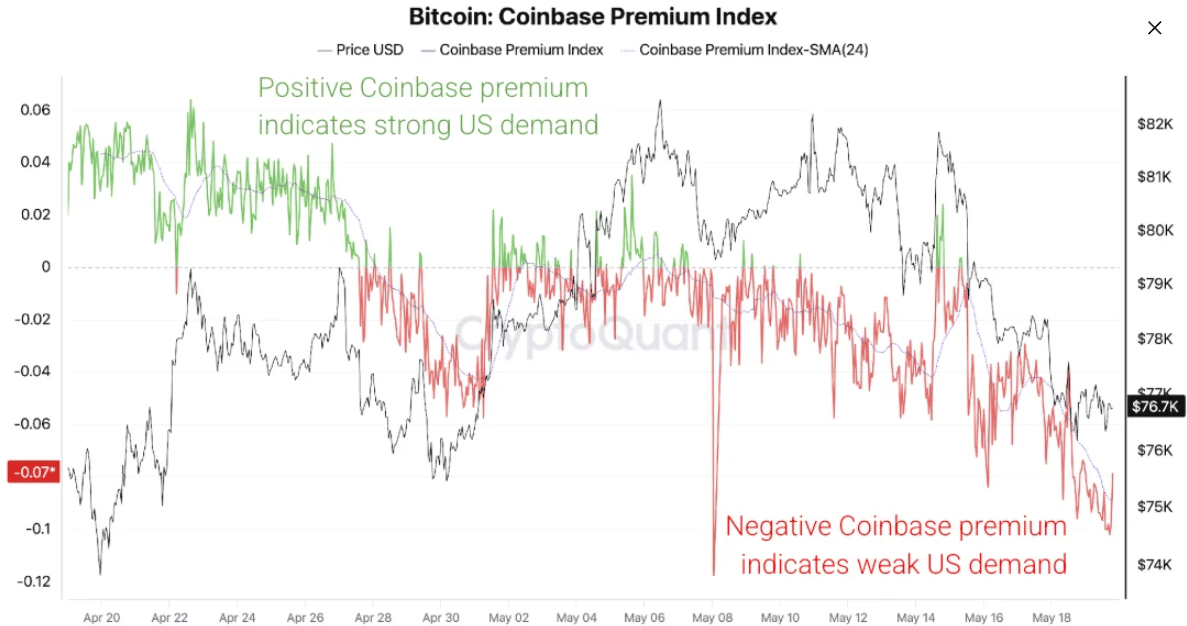
In addition, the Coinbase Bitcoin Price Premium chart below has remained negative so far in the May rally and subsequent correction, confirming that US investor demand has not re-engaged at scale, further indicating weakness in demand.
This combination of futures positioning, spot demand, and ETF flows has historically been more consistent with renewed price weakness than with stable consolidation.
Some other signs of concern
Beyond the weakening demand, traders should also be cautious as the Federal Open Market Committee (FOMC) Minutes for the April meeting on Wednesday confirmed a hawkish tone in the Federal Reserve (Fed) outlook.
The majority of Fed officials warned the central bank would likely need to consider raising interest rates if inflation continued to run persistently above the 2% target. Officials broadly agreed that inflation risks were skewed to the upside and also acknowledged that the conflict in the Middle East could materially alter the balance of risks and complicate the outlook going forward.
This hawkish forward guidance from the Fed will likely lead the central bank to tighten policy, which generally doesn’t bode well for the Crypto King. In high-interest-rate environments, liquidity declines and markets shift towards safer, yield-bearing assets, weighing on BTC.
Bitcoin Price Forecast: BTC key level holds strong
Bitcoin price extends recovery, trading above $77,800 on Thursday after finding support around the 50-day and 100-day Exponential Moving Averages (EMAs) near $76,812 and $76,903, respectively, earlier this week. This suggests underlying dip demand, but Bitcoin still trades below the 200-day EMA near $81,708, keeping the broader advance capped for now.
The Relative Strength Index (RSI) at 48 is slightly soft, while the Moving Average Convergence Divergence (MACD) remains below zero, suggesting that bullish momentum is subdued despite the ongoing consolidation above trend support.
On the topside, initial resistance aligns with the the 50% Fibonacci retracement at $78,962 (drawn from the January high to the February low), ahead of the 200-day EMA at $81,708, with further barriers at the 61.8% Fibonacci retracement near $83,437 and the horizontal resistance around $84,410.
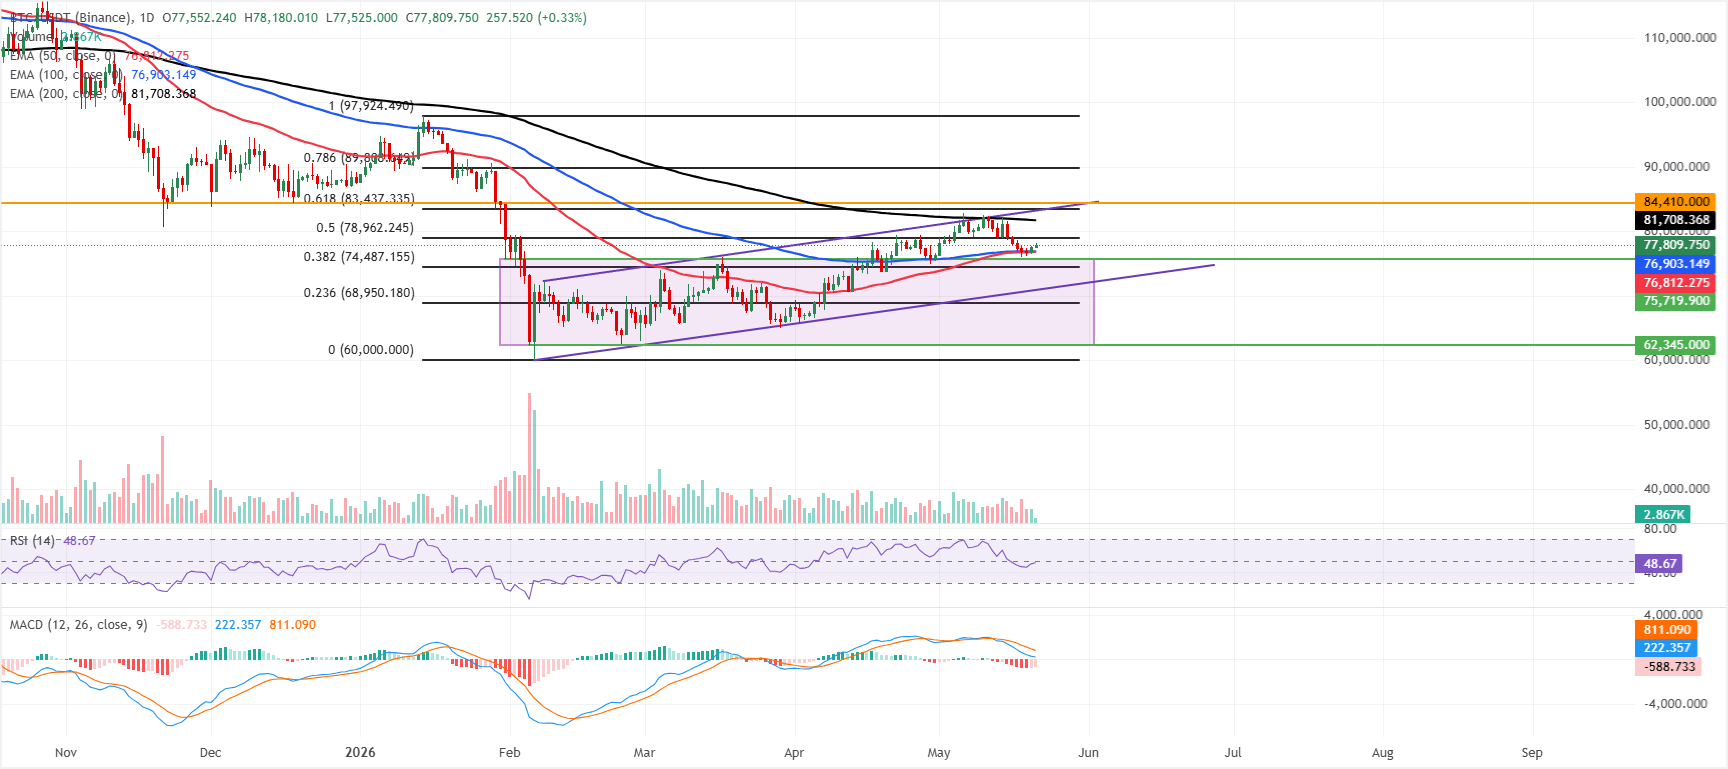
On the downside, immediate support is provided by the 100-day and 50-day EMAs, clustered just under spot, followed by the 38.2% Fibonacci level near $74,487. The former trendline break zone around $70,815 and the 23.6% Fibonacci retracement at $68,950 provide deeper cushioning if selling pressure extends.
(The technical analysis of this story was written with the help of an AI tool.)
Bitcoin, altcoins, stablecoins FAQs
Bitcoin is the largest cryptocurrency by market capitalization, a virtual currency designed to serve as money. This form of payment cannot be controlled by any one person, group, or entity, which eliminates the need for third-party participation during financial transactions.
Altcoins are any cryptocurrency apart from Bitcoin, but some also regard Ethereum as a non-altcoin because it is from these two cryptocurrencies that forking happens. If this is true, then Litecoin is the first altcoin, forked from the Bitcoin protocol and, therefore, an “improved” version of it.
Stablecoins are cryptocurrencies designed to have a stable price, with their value backed by a reserve of the asset it represents. To achieve this, the value of any one stablecoin is pegged to a commodity or financial instrument, such as the US Dollar (USD), with its supply regulated by an algorithm or demand. The main goal of stablecoins is to provide an on/off-ramp for investors willing to trade and invest in cryptocurrencies. Stablecoins also allow investors to store value since cryptocurrencies, in general, are subject to volatility.
Bitcoin dominance is the ratio of Bitcoin's market capitalization to the total market capitalization of all cryptocurrencies combined. It provides a clear picture of Bitcoin’s interest among investors. A high BTC dominance typically happens before and during a bull run, in which investors resort to investing in relatively stable and high market capitalization cryptocurrency like Bitcoin. A drop in BTC dominance usually means that investors are moving their capital and/or profits to altcoins in a quest for higher returns, which usually triggers an explosion of altcoin rallies.
Author

Manish Chhetri
FXStreet
Manish Chhetri is a crypto specialist with over four years of experience in the cryptocurrency industry.


