Bitcoin Price Forecast: BTC hits three-month high on derivatives-led surge
- Bitcoin price surges above $80,000 on Monday, the highest level since the end of January.
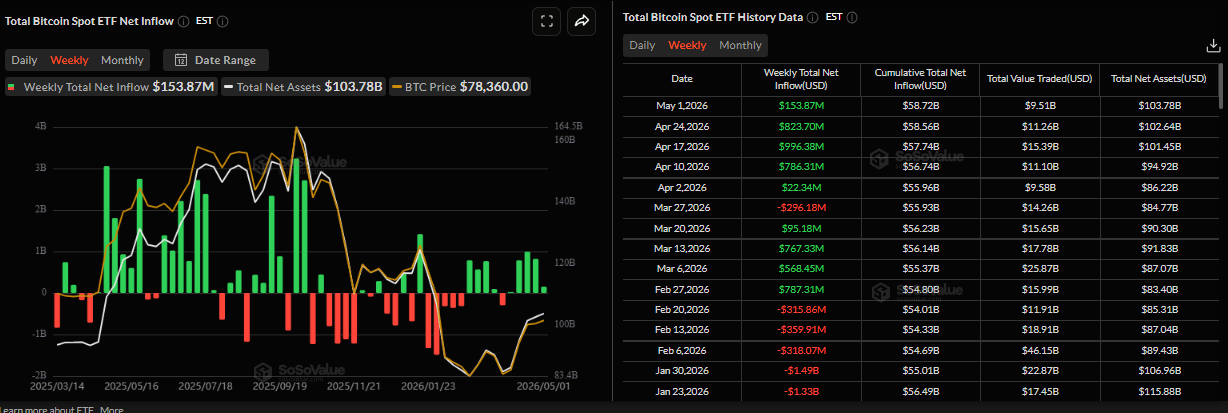
- US-listed spot ETF recorded inflows of $153.87 million last week, marking the fifth consecutive week of positive flows.
- Traders should be cautious, as the BTC price surge is driven by perpetual futures demand while spot markets remain in contraction.
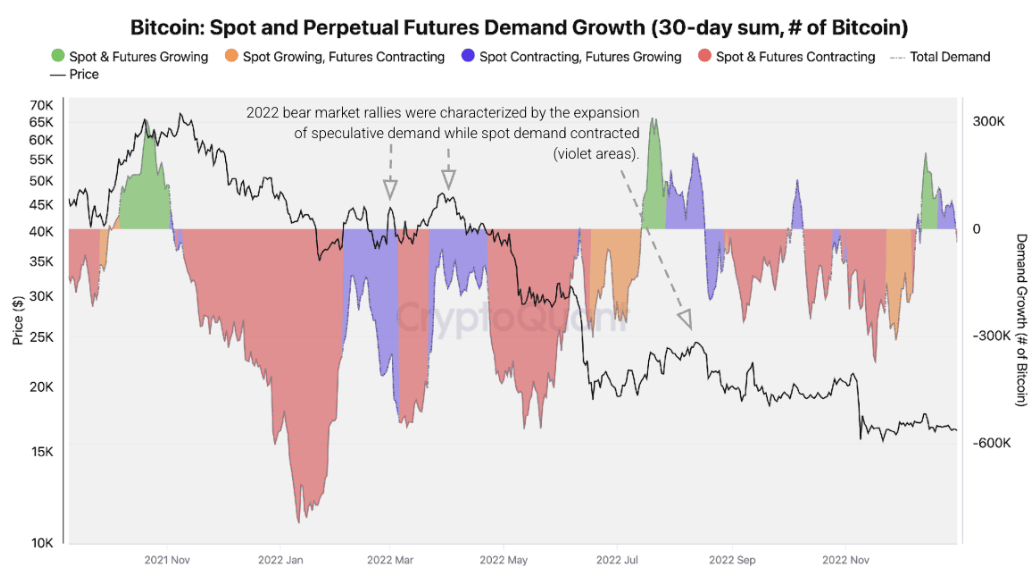
- Reports highlight that the current market structure is more speculative than fundamental, mirroring the pattern seen at the onset of the 2022 bear market.

Bitcoin (BTC) price surges above $80,000 on Monday, reaching the highest level since the end of January. Institutional demand supports this price surge, as spot Exchange Traded Funds (ETFs) recorded inflows of over $153 million last week, marking the fifth consecutive week of positive flows. Meanwhile, the Crypto King is near a key psychological level. Analysts noted that the current market structure is more speculative than fundamental, mirroring the pattern seen at the onset of the 2022 bear market.
Institutional demand remains robust
Bitcoin’s price continues its rally, reaching a high of $80,635 on Monday after a mild consolidation the previous week. Institutional demand supports the price surge, as it remains robust. SoSoValue data show that BTC spot ETFs recorded an inflow of $153.87 million last week, marking the fifth consecutive weekly inflow since early April. If this trend continues this week, BTC could see a further price rally.
Derivatives-driven surge
CryptoQuant’s weekly report last week highlighted that the Bitcoin price surge in April was driven entirely by growth in perpetual futures demand.
The chart below shows that the recent price surge in the Crypto King was more of a speculative rally than a fundamental one, as spot demand remained contracted.
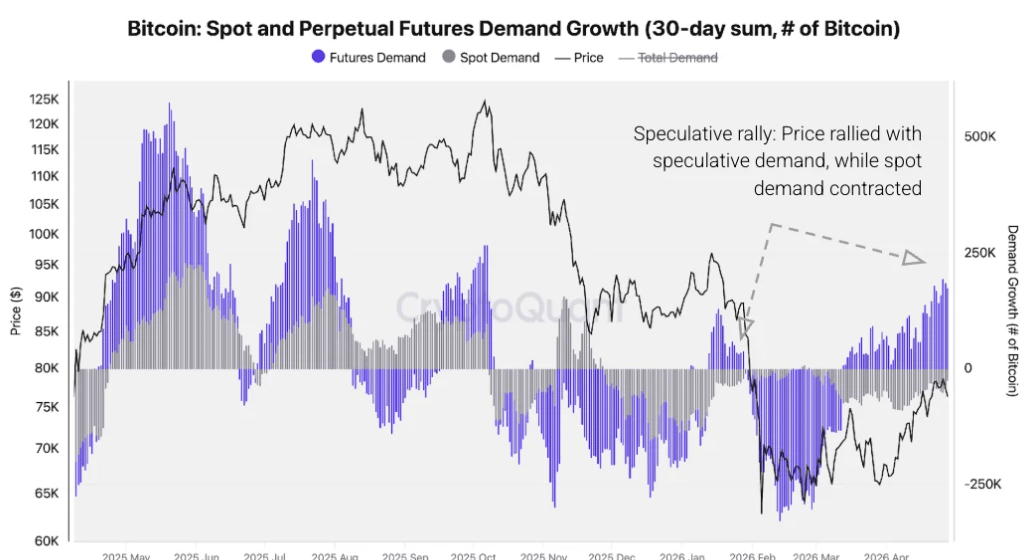
“Perpetual futures demand was the sole driver of Bitcoin’s April price rally, while spot apparent demand contracted throughout, a configuration historically associated with unsustained price gains during bear markets,” noted the CryptoQuants’ analyst.
“This divergence—rising futures demand alongside contracting spot demand—suggests price appreciation is driven by leverage rather than fresh coin accumulation. Historically, such configurations lack the structural foundation required to sustain price gains and typically resolve via correction once futures positioning unwinds,” he added.
Current market structure mirrors the onset of the 2022 bear market
The current market structure mirrors the pattern seen at the onset of the 2022 bear market, when perpetual futures demand surged in isolation while spot demand contracted simultaneously, a configuration that preceded a sustained multi-month price decline.
The analyst concluded that, “The similarity does not guarantee an identical outcome, but it establishes that the current demand structure is consistent with historically bearish precedent. On-chain demand decomposition, applied consistently across cycles, identifies this pattern as a reliable early indicator of price fragility.”
Bitcoin Price Forecast: BTC surge to key psychological level
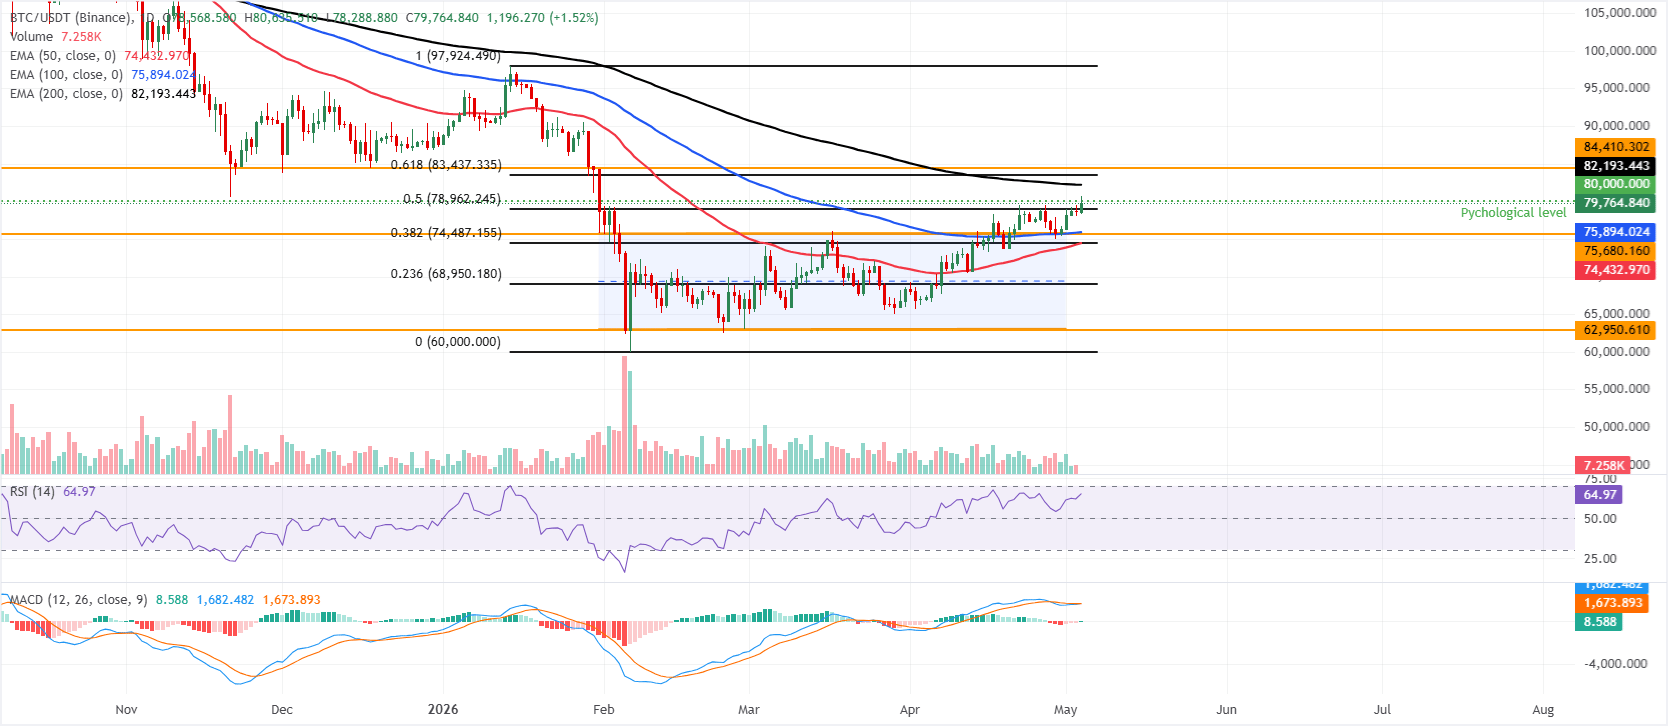
Bitcoin is trading above $79,700 at the time of writing on Monday, maintaining a bullish near-term bias as it consolidates above the 50- and 100-day Exponential Moving Averages (EMAs), clustered around the mid-$70,000s.
BTC is also trading above the 50% retracement (drawn from January high to the February low) at roughly $78,962 and the top of the horizontal parallel channel near $75,680, suggesting the broader uptrend remains supported, while a firm Relative Strength Index (RSI) on the daily chart around 65 and a recovering Moving Average Convergence Divergence (MACD) reading hint that upside momentum is still constructive.
On the topside, immediate resistance is located at the psychological $80,000 level, followed by the 200-day EMA near $82,193 and the 61.8% Fibonacci retracement around $83,437, ahead of a higher horizontal barrier at about $84,410.
On the downside, initial support is seen at the 50% retracement at $78,962, with additional demand expected around the upper channel boundary near the level at $75,680, reinforced by the 100-day EMA just under $75,900. Deeper pullbacks would expose the 38.2% Fibonacci retracement and 50-day EMA in the $74,432-$74,487 area before the broader channel floor and major support zone around $63,000.
(The technical analysis of this story was written with the help of an AI tool.)
Bitcoin, altcoins, stablecoins FAQs
Bitcoin is the largest cryptocurrency by market capitalization, a virtual currency designed to serve as money. This form of payment cannot be controlled by any one person, group, or entity, which eliminates the need for third-party participation during financial transactions.
Altcoins are any cryptocurrency apart from Bitcoin, but some also regard Ethereum as a non-altcoin because it is from these two cryptocurrencies that forking happens. If this is true, then Litecoin is the first altcoin, forked from the Bitcoin protocol and, therefore, an “improved” version of it.
Stablecoins are cryptocurrencies designed to have a stable price, with their value backed by a reserve of the asset it represents. To achieve this, the value of any one stablecoin is pegged to a commodity or financial instrument, such as the US Dollar (USD), with its supply regulated by an algorithm or demand. The main goal of stablecoins is to provide an on/off-ramp for investors willing to trade and invest in cryptocurrencies. Stablecoins also allow investors to store value since cryptocurrencies, in general, are subject to volatility.
Bitcoin dominance is the ratio of Bitcoin's market capitalization to the total market capitalization of all cryptocurrencies combined. It provides a clear picture of Bitcoin’s interest among investors. A high BTC dominance typically happens before and during a bull run, in which investors resort to investing in relatively stable and high market capitalization cryptocurrency like Bitcoin. A drop in BTC dominance usually means that investors are moving their capital and/or profits to altcoins in a quest for higher returns, which usually triggers an explosion of altcoin rallies.
Author

Manish Chhetri
FXStreet
Manish Chhetri is a crypto specialist with over four years of experience in the cryptocurrency industry.



