BHP Group Limited – BHP Elliott Wave analysis and forecast [Video]
![BHP Group Limited – BHP Elliott Wave analysis and forecast [Video]](https://editorial.fxsstatic.com/images/i/windows-02_XtraLarge.jpg)
ASX: BHP Group Limited – BHP Elliott Wave technical analysis
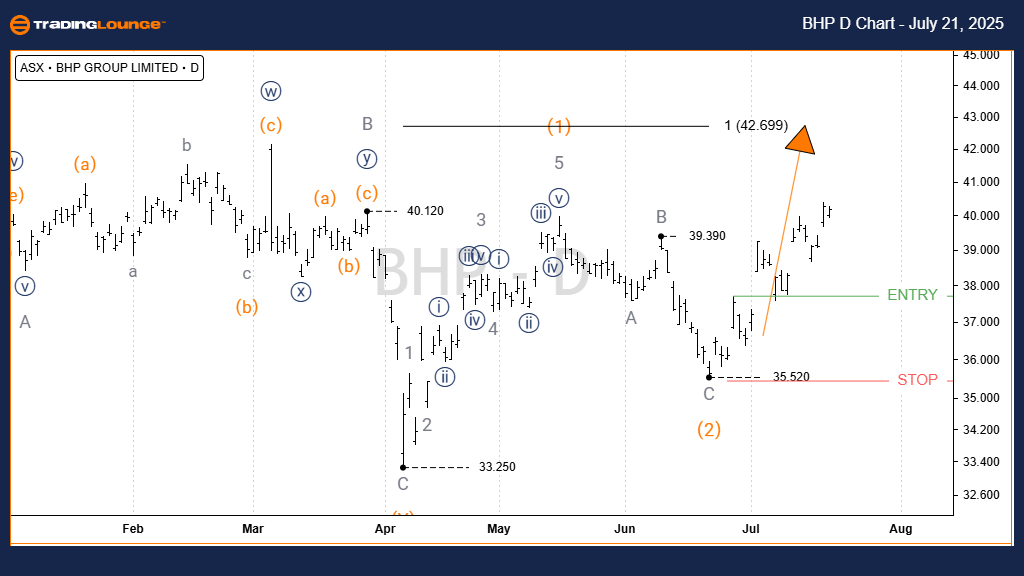
Today's Elliott Wave analysis brings an update for BHP GROUP LIMITED – BHP on the Australian Stock Exchange (ASX). Based on our analysis, ASX:BHP has potential for further upward movement. The wave 2 (orange) appears to have ended as a Zigzag pattern, which could lead into a stronger wave 3 (orange) rally. This article focuses on potential price targets and the conditions needed for this forecast to remain valid.
BHP Elliott Wave technical analysis – One-day chart
-
Function: Major Trend (Intermediate Degree, Orange).
-
Mode: Motive.
-
Structure: Impulse.
-
Position: Wave 3 (Orange).
Analysis details: From the low of 33.25, wave 1 (orange) completed as a five-wave pattern. Following this, wave 2 (orange) likely completed a Zigzag correction labeled A-B-C (grey). This structure now supports the development of wave 3 (orange), targeting a range between 42.70 and 47.84. The bullish scenario remains valid as long as the price stays above 35.52.
- Invalidation point: 35.52.
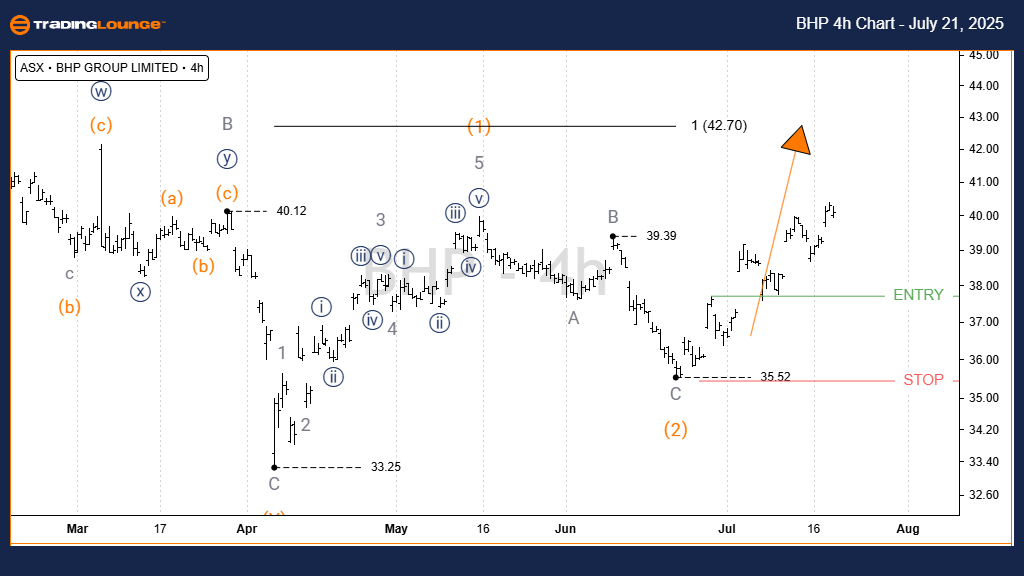
ASX: BHP Elliott Wave technical analysis – Four-hour chart
-
Function: Major Trend (Intermediate Degree, Orange).
-
Mode: Motive.
-
Structure: Impulse.
-
Position: Wave 3 (Orange).
Detailed analysis: Looking into the 4-hour chart, the structure confirms the previous 1D chart outlook. Traders can consider a Long Trade setup once the price breaks above the Entry level, triggering confirmation of the uptrend.
- Invalidation point: 35.52.
Conclusion
This analysis delivers an updated Elliott Wave count and short-term strategy for ASX: BHP GROUP LIMITED – BHP. It highlights current market conditions and how traders might capitalize on them. Price points are clearly defined to validate or invalidate the current wave outlook, supporting higher confidence in trading decisions. Our goal is to provide precise and practical insights into price action.
BHP Group Limited – BHP Elliott Wave analysis and forecast [Video]
Author

Peter Mathers
TradingLounge
Peter Mathers started actively trading in 1982. He began his career at Hoei and Shoin, a Japanese futures trading company.


