Berkshire Hathaway Inc. (BRK.B) Elliott Wave technical analysis [Video]
![Berkshire Hathaway Inc. (BRK.B) Elliott Wave technical analysis [Video]](https://editorial.fxsstatic.com/images/i/General-Stocks_1_XtraLarge.png)
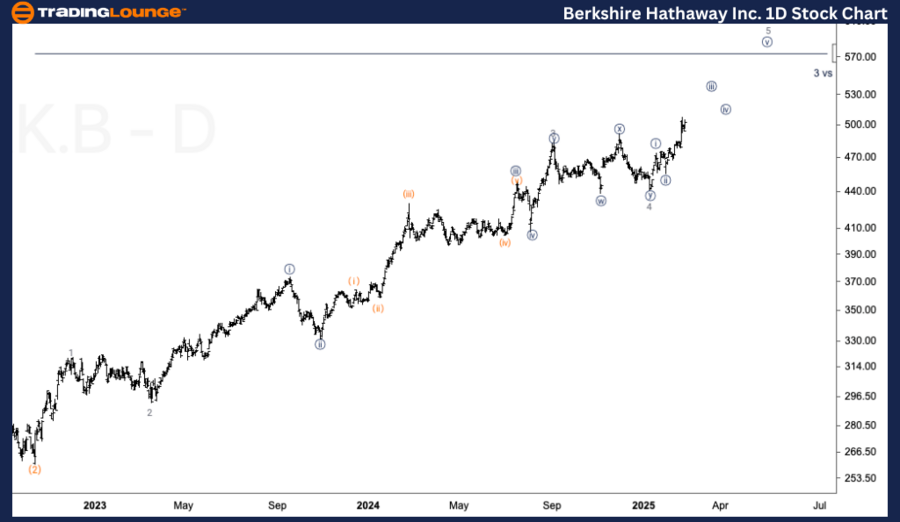
Berkshire Hathaway Inc. (BRK.B) Elliott Wave analysis – Daily chart
-
Function: Trend.
-
Mode: Impulsive.
-
Structure: Motive.
-
Position: Wave 5 of (3).
-
Direction: Upside into wave 5.
Details:
-
Expecting upside continuation into wave 5, with targets around $570.
-
Key support above $500 is needed to confirm the bullish momentum.
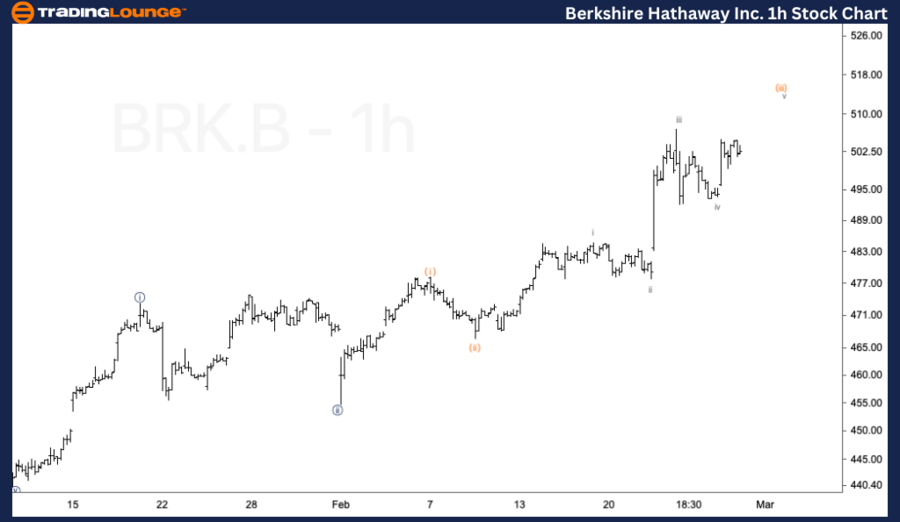
Berkshire Hathaway Inc. (BRK.B) Elliott Wave Analysis – One-hour chart
-
Function: Trend.
-
Mode: Impulsive.
-
Structure: Motive.
-
Position: Wave (iii) of {iii}.
-
Direction: Upside in wave (iii).
Details:
-
Recent upmove from the January bottom is unfolding in threes and fours.
-
Expecting further bullish momentum before a larger-degree top in wave {iii}.
Conclusion
This equities analysis highlights key market trends across multiple stocks and ETFs using Elliott Wave Theory.
-
Stocks like BRK.B, LLY, MELI, and V show impulsive trends, signaling further upside potential.
-
Corrective patterns in AVY, PG, and SMH indicate areas where traders should be cautious.
-
Key resistance and support levels are critical in confirming future market moves.
Berkshire Hathaway Inc. (BRK.B) Elliott Wave technical analysis [Video]
Author

Peter Mathers
TradingLounge
Peter Mathers started actively trading in 1982. He began his career at Hoei and Shoin, a Japanese futures trading company.


