|

BABA: The bearish trend continues

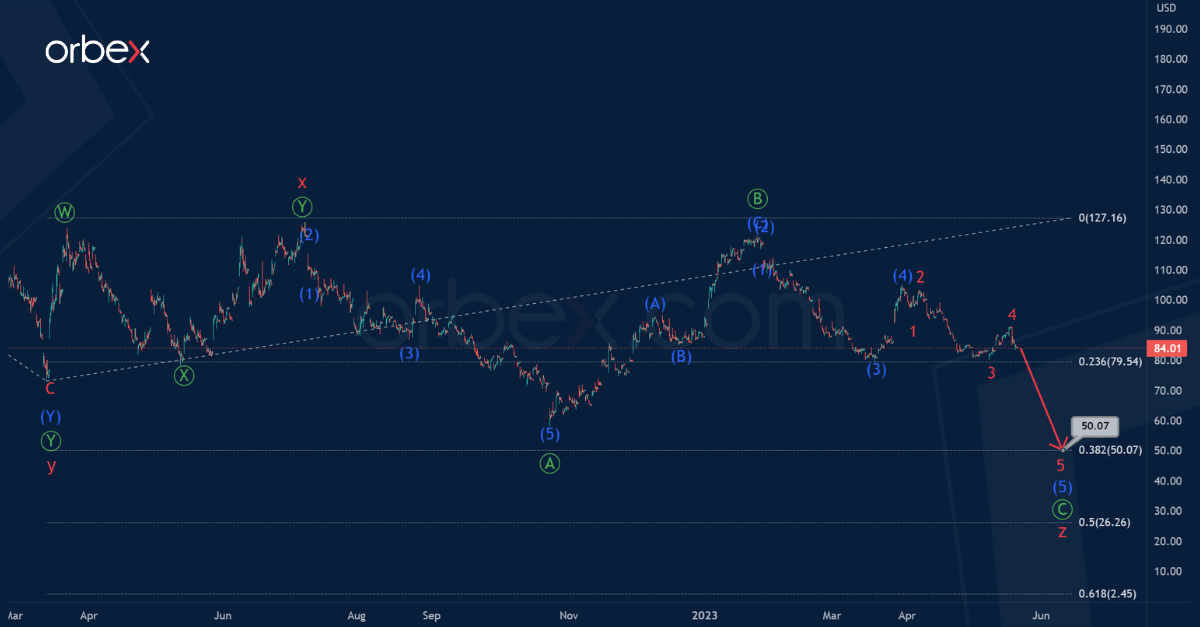
We talked about BABA shares about a month ago, we see that a bearish trend is forming. The current chart shows the final part of the completed actionary wave y and the second intervening wave x. These waves are double zigzags. At the moment we are seeing the formation of the final actionary wave z, which, most likely, will take the form of a primary zigzag.
Chart

There is a high probability that the primary impulse and the correction have already been fully completed, so we can expect a decline to 50.07 in the sub-wave consisting of sub-waves (1)-(2)- (3)-(4)-(5).

At the specified mark, wave z will be at 38.2% of wave y.
Chart

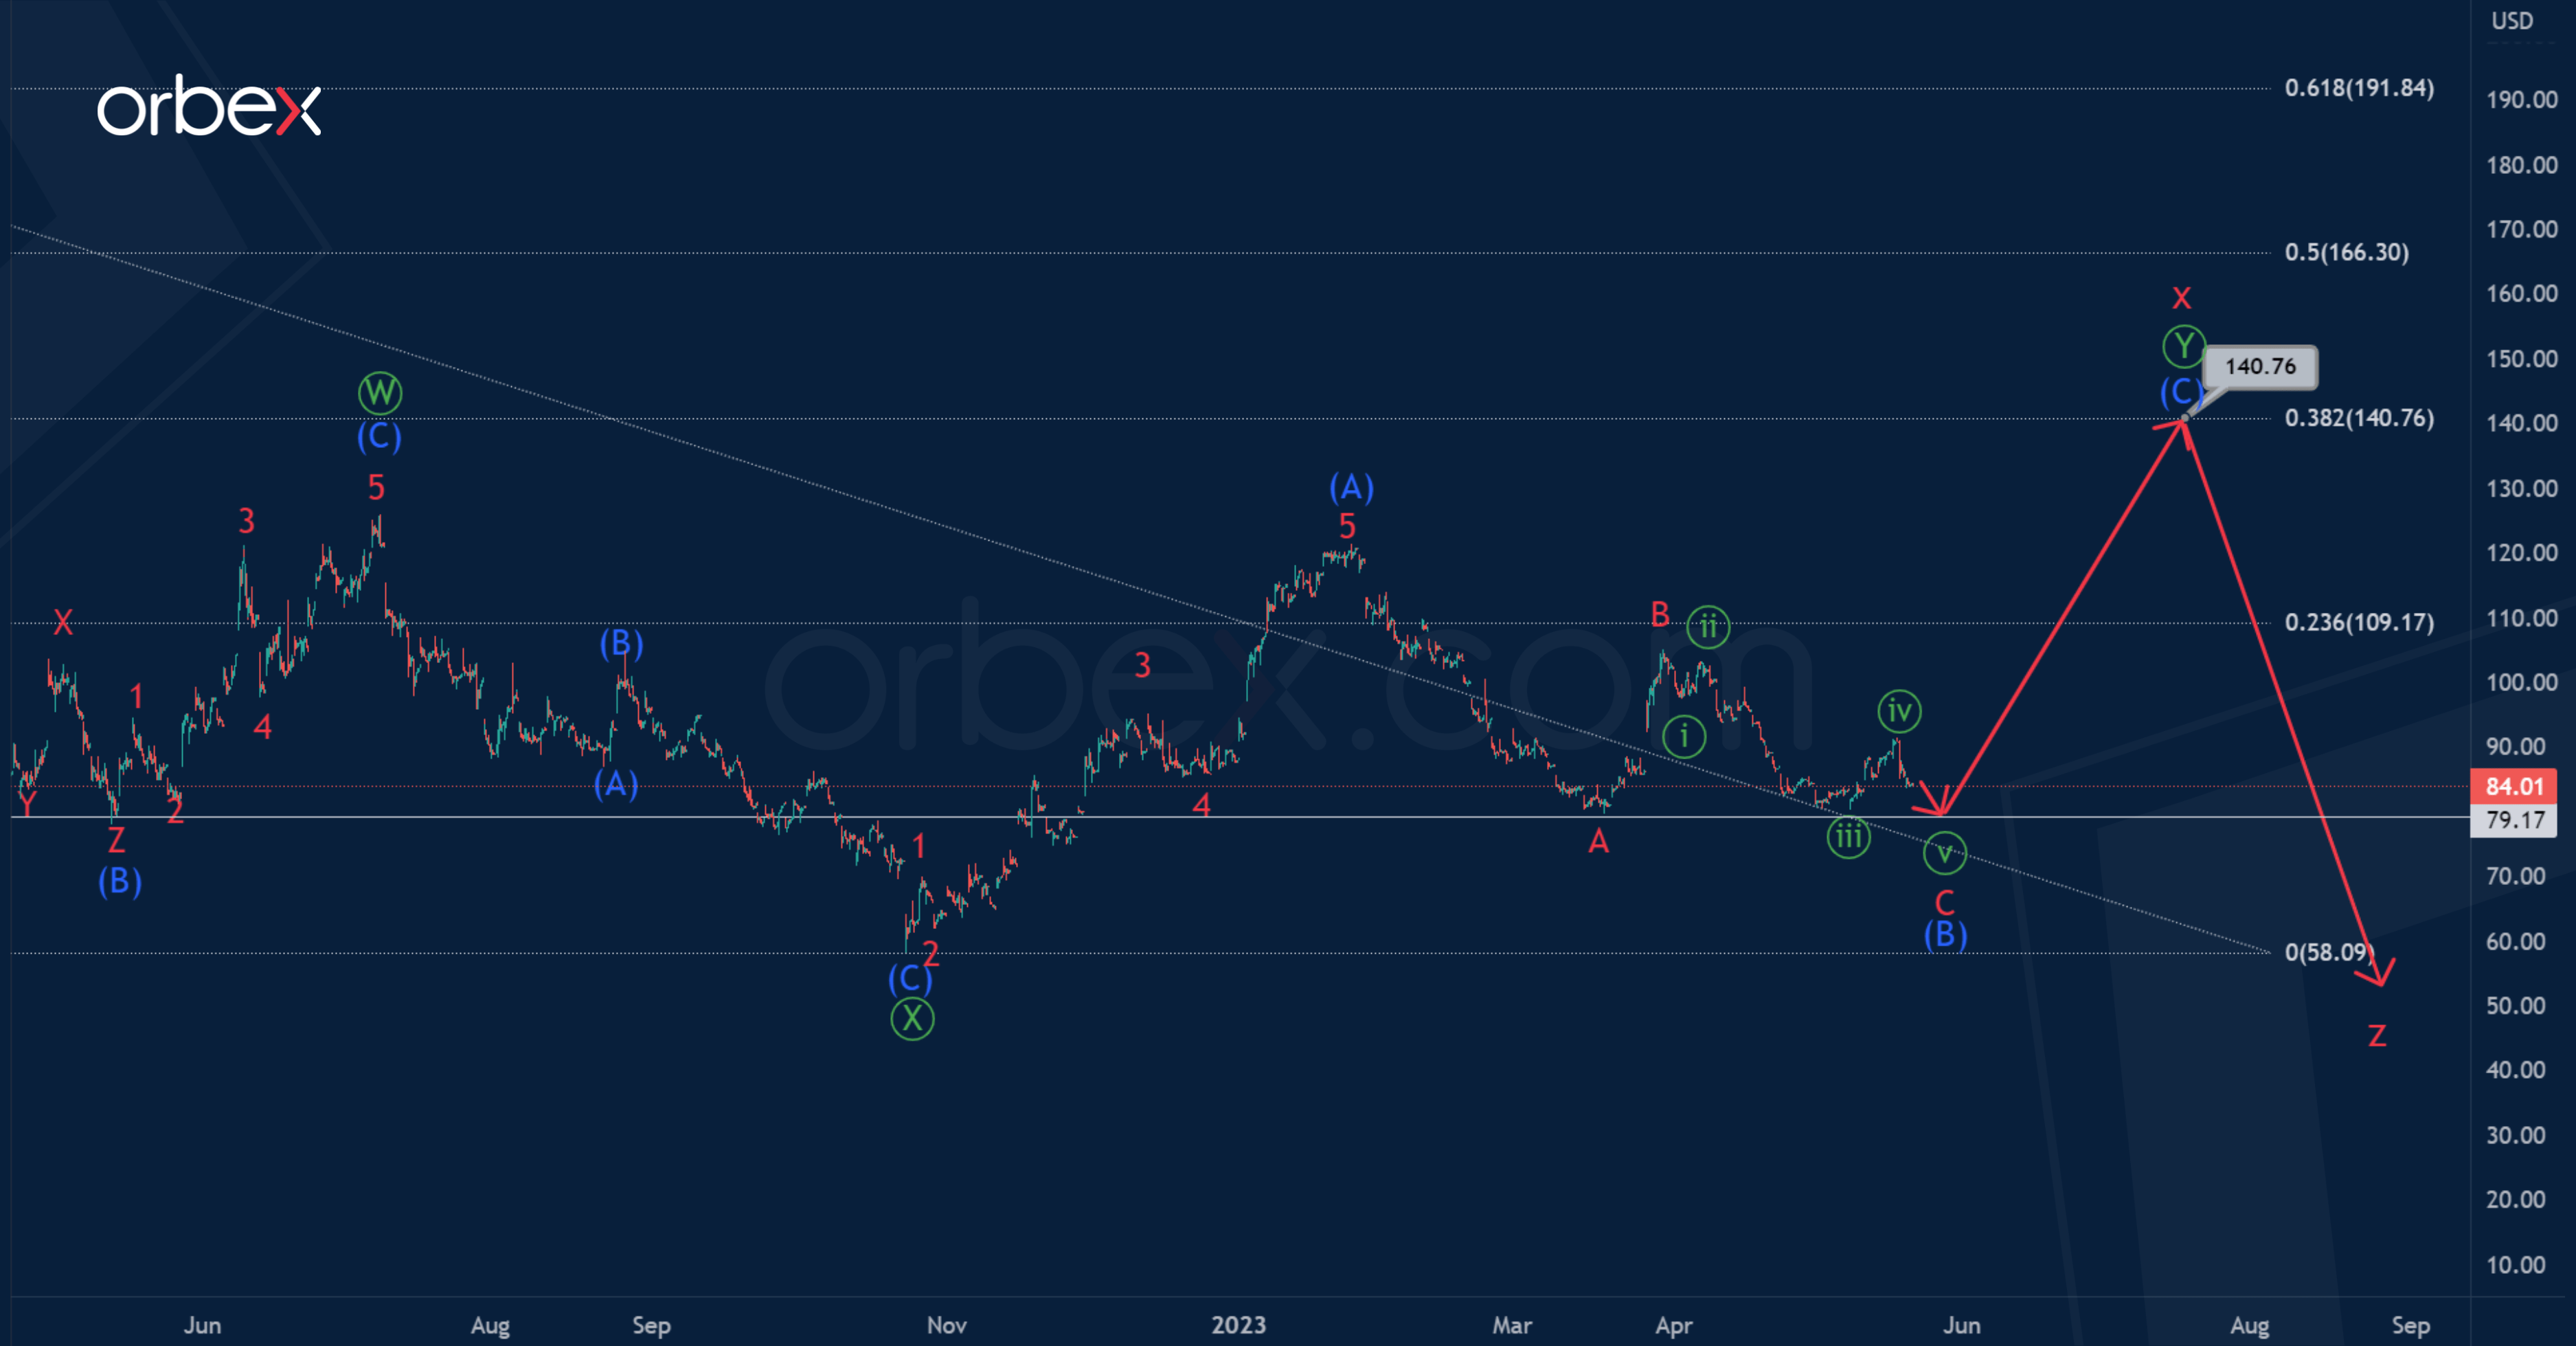
Alternatively, the intervening wave x has a more complex internal structure. Within the intervening wave x, only the first two zigzag sub-waves are completed.

At the moment, the market is in a wave, which may take a zigzag structure (A)-(B)-(C) of the intermediate degree.

Most likely, we are approaching the minimum of 79.17, at which the correction (B) may end, after which the price may begin to rise in the potential impulse (C).

The price in the intermediate wave (C) is likely to rise to 140.76. At that level, cycle intervening wave x will be at 38.2% of actionary wave y.

Author

Jing Ren

Jing-Ren has extensive experience in currency and commodities trading. He began his career in metal sales and trading at Societe Generale in London.


More from Jing Ren
Share:

Editor's Picks

GBP/USD clings to 1.3500 amid marginal losses

GBP/USD alternates gains with losses around the 1.3500 neighbourhood on Tuesday. Indeed, Cable struggles to further extend its incipient recovery in a context of continuous instability in the Middle East and modest gains in the Greenback.

EUR/USD alternates gains with losses near 1.1540

EUR/USD navigates a tight range near 1.1550 in the latter part of Tuesday’s NA session. The US Dollar’s vacillating price action accompanies the pair while market participants gear up for the crucial US inflation data due on Wednesday.

Gold trades with positive bias below $4,400; Fed hike bets cap gains ahead of US CPI

Gold attracts some dip-buyers during the Asian session on Wednesday, stalling the previous day's retracement slide from the $4,435 region, or the highest level since June 5. The commodity, however, remains below the $4,400 mark as traders await key US inflation figures for fresh cues about the US Federal Reserve's future policy path before placing fresh directional bets on the non-yielding yellow metal.

Bitcoin risks liquidation-driven spikes amid deepening market apathy

Bitcoin has remained trapped between $60,000 and $80,000 for six consecutive months, reflecting a market increasingly defined by apathy and weak trading activity. However, such thin volumes combined with elevated open interest leave room for sudden spikes in liquidation, according to a Tuesday report by K33.

US Dollar: CPI keeps USD in tight ranges

OCBC’s Sim Moh Siong and Christopher Wong note the US Dollar softened as Fed hike expectations moderated and the US yield curve steepened. They argue that without a strong upside surprise in United States Consumer Price Index, the USD should stay rangebound, supporting carry trades.

9-3: Is the Federal Reserve’s vote tally Warsh's new forward guidance?
The rate did not move. Neither did the statement, and that’s the more interesting fact. Set the July 29 Federal Open Market Committee (FOMC) statement beside the one issued on June 17, and the two documents are identical apart from a single verb and a paragraph at the bottom naming three dissenters.















