Australian Dollar plunges against US Dollar ahead of US NFP data
- Australian Dollar tumbles against the US Dollar to near 0.6862 as the latter outperforms.
- Global AI rout has improved the safe-haven demand of the US Dollar.
- Investors keenly await the US NFP data for September.

The Australian Dollar (AUD) faces intense selling pressure against the US Dollar (USD) on Friday. In the European trade, the AUD/USD pair posted a fresh seven-month low at 0.6862.
The Aussie pair falls sharply as the US Dollar outperforms due to an improvement in demand for safe-haven assets amid global sell-off in Artificial Intelligence (AI) infrastructure stocks.
US Dollar Price Today
The table below shows the percentage change of US Dollar (USD) against listed major currencies today. US Dollar was the strongest against the New Zealand Dollar.
| USD | EUR | GBP | JPY | CAD | AUD | NZD | CHF | |
|---|---|---|---|---|---|---|---|---|
| USD | 0.36% | 0.38% | 0.30% | 0.36% | 0.85% | 0.91% | 0.15% | |
| EUR | -0.36% | 0.02% | -0.07% | 0.00% | 0.50% | 0.56% | -0.21% | |
| GBP | -0.38% | -0.02% | -0.06% | -0.02% | 0.48% | 0.54% | -0.23% | |
| JPY | -0.30% | 0.07% | 0.06% | 0.07% | 0.56% | 0.61% | -0.15% | |
| CAD | -0.36% | -0.00% | 0.02% | -0.07% | 0.49% | 0.54% | -0.22% | |
| AUD | -0.85% | -0.50% | -0.48% | -0.56% | -0.49% | 0.05% | -0.70% | |
| NZD | -0.91% | -0.56% | -0.54% | -0.61% | -0.54% | -0.05% | -0.74% | |
| CHF | -0.15% | 0.21% | 0.23% | 0.15% | 0.22% | 0.70% | 0.74% |
The heat map shows percentage changes of major currencies against each other. The base currency is picked from the left column, while the quote currency is picked from the top row. For example, if you pick the US Dollar from the left column and move along the horizontal line to the Japanese Yen, the percentage change displayed in the box will represent USD (base)/JPY (quote).
At press time, the US Dollar Index (DXY), which gauges the Greenback’s value against six major currencies, trades 0.42% higher to near 102.00.
Dollar regains post-election losses as tightening US conditions raise downside risks
Analysts at MUFG observe that the “spillover impact from the AI-related equity market sell-off into the foreign exchange market has remained surprisingly modest so far.” Even so, they note that the episode “has resulted in the dollar index reversing all of its initial losses since the US mid-term election results were announced,” underscoring the currency’s resilience amid tighter US financial conditions.
The USD Index slumped to a fresh monthly low near 101.00 after the outcome of US midterm elections on Wednesday, in which Democrats won majority in both the House and the Senate.
MUFG points out that “US dollar strength this year has been supported by higher energy prices and record foreign demand for riskier US assets.” However, it cautioned that “if both these drivers continue to reverse, it would increase the likelihood of the US dollar weakening,” particularly if risk appetite for US assets fades further. In addition, the bank warns that “if financial conditions continue to tighten it could make it less likely that the Federal Reserve (Fed) will hike again in December as planned thereby adding to downside risks for the US Dollar.”
For fresh cues regarding the Fed’s monetary policy outlook, investors await the US Nonfarm Payrolls (NFP) data for October, which will be published at 13:30 GMT.
The US NFP report is expected to show that the economy created 65K new jobs, higher than 29K in September. The Unemployment Rate is seen as steady at 4.2%.
On the Aussie front, investors seek fresh cues regarding whether the Reserve Bank of Australia (RBA) will hike interest rates again this year. So far in 2026, the RBA has delivered five quarter-to-a-percent hikes, pushing the Official Cash Rate (OCR) to 4.85%.
This week, the RBA hiked rates, but the communication signaled hesitation on further tightening. “Voters favoring pause perceived greater downside risks,” RBA Governor Michele Bullock said. Bullock added, “Those favoring a hold wanted to wait longer for data.” She further added, “Not definitely hiking rates again, preserving options.”
AUD/USD Technical Analysis
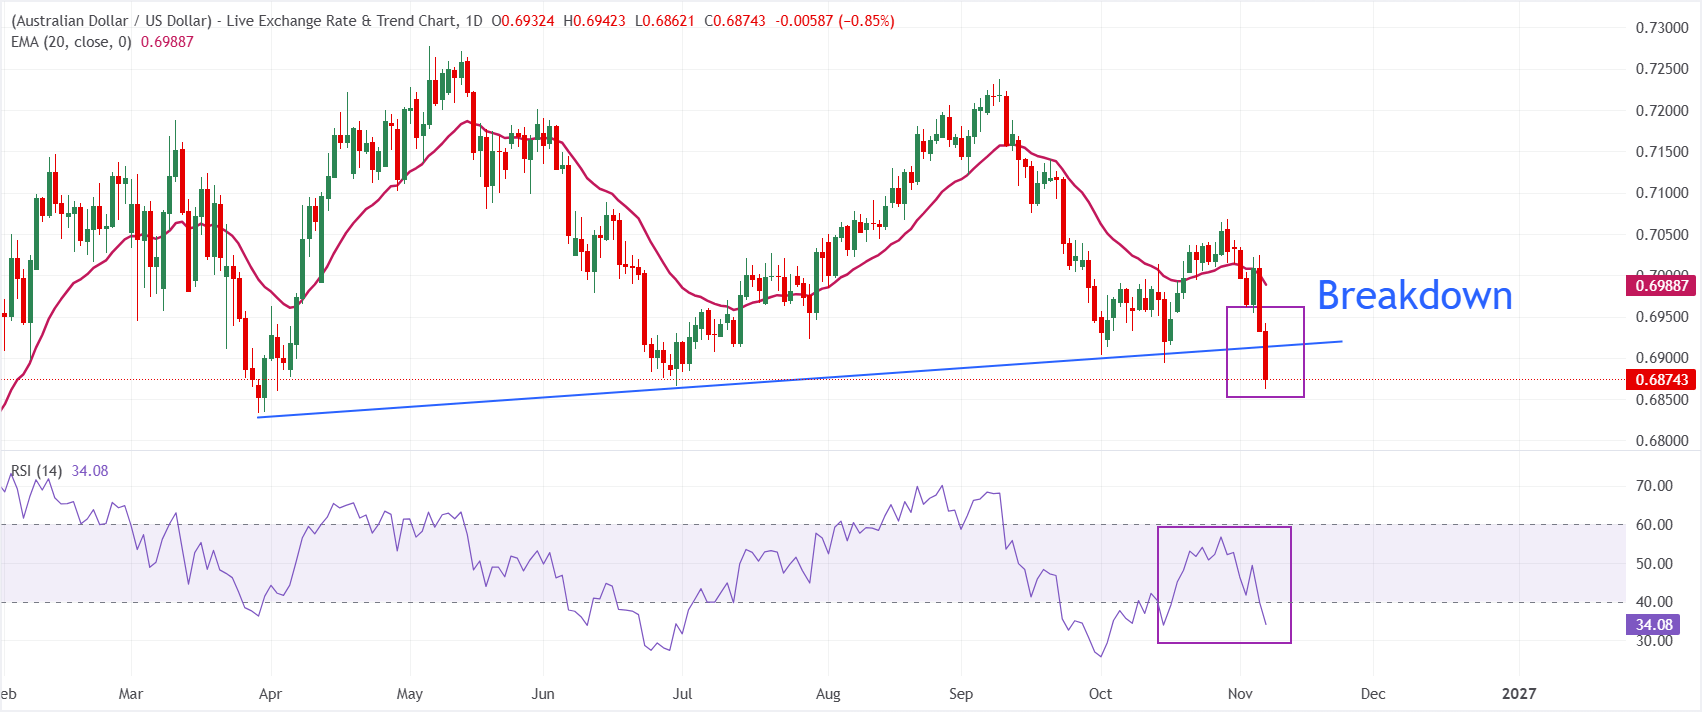
In the daily chart, AUD/USD trades at 0.6874, holding a bearish near-term bias as spot remains capped beneath the 20-period exponential moving average (EMA) at 0.6989 and below the former trend-line support turned barrier near 0.6913. Price action sits under these key overhead levels, keeping the pair under pressure, while the Relative Strength Index (14) at 34 suggests weak but not extreme bearish momentum, hinting that sellers still dominate despite the recent slowdown.
On the topside, initial resistance emerges at the broken upward trend line around 0.6913, followed by the 20-day EMA at 0.6989, which reinforces the broader bearish structure as long as it stays overhead. On the downside, nearby structural support is seen at the prior trend-line anchor around 0.6828; a decisive break below this floor would open the door to further losses, while holding above it would merely signal consolidation within an overall capped market.
(The technical analysis of this story was written with the help of an AI tool. Know more.)
Economic Indicator
Nonfarm Payrolls
The Nonfarm Payrolls release presents the number of new jobs created in the US during the previous month in all non-agricultural businesses; it is released by the US Bureau of Labor Statistics (BLS). The monthly changes in payrolls can be extremely volatile. The number is also subject to strong reviews, which can also trigger volatility in the Forex board. Generally speaking, a high reading is seen as bullish for the US Dollar (USD), while a low reading is seen as bearish, although previous months' reviews and the Unemployment Rate are as relevant as the headline figure. The market's reaction, therefore, depends on how the market assesses all the data contained in the BLS report as a whole.
Read more.Next release: Fri Nov 06, 2026 13:30
Frequency: Monthly
Consensus: 65K
Previous: 29K
Source: US Bureau of Labor Statistics
America’s monthly jobs report is considered the most important economic indicator for forex traders. Released on the first Friday following the reported month, the change in the number of positions is closely correlated with the overall performance of the economy and is monitored by policymakers. Full employment is one of the Federal Reserve’s mandates and it considers developments in the labor market when setting its policies, thus impacting currencies. Despite several leading indicators shaping estimates, Nonfarm Payrolls tend to surprise markets and trigger substantial volatility. Actual figures beating the consensus tend to be USD bullish.
Author

Sagar Dua
FXStreet
Sagar Dua is associated with the financial markets from his college days. Along with pursuing post-graduation in Commerce in 2014, he started his markets training with chart analysis.