|

AUD/USD Price Analysis: Retreats from golden Fibonacci ratio on China data, 0.6640-35 eyed

  • AUD/USD fades upside momentum at the highest levels in three weeks, prods intraday low of late.
  • China trade surplus eases, imports increase but exports drop in May.
  • 61.8% Fibonacci retracement prods Aussie buyers amid overbought RSI conditions.
  • Sellers need validation from convergence of 200-SMA, 50% Fibonacci retracement level.

AUD/USD bulls struggle to keep the reins as China trade numbers join downbeat Australia’s first quarter (Q1) Gross Domestic Product (GDP) to prod the upside momentum at the highest levels in three weeks. That said, the Aussie pair retreats towards the intraday low surrounding 0.6670 heading into Wednesday’s European session.

China’s headline Trade Balance deteriorates to $65.81 billion versus the $92.0 billion expected and $90.21 billion previous readings. That said, the Exports and Imports came in mixed with the former falling past -0.4% expected and 8.5% previous readings to -7.5% YoY whereas the latter improves to 2.3% from -0.8% market forecasts and 4.2% prior.

On the other hand, Aussie Q1 GDP rose 0.2% QoQ compared to 0.5% previous readings and 0.3% market forecasts. On the same line, the yearly GDP came in as 2.3% versus the analysts’ estimation of 2.4% YoY and 2.7% previous readings.

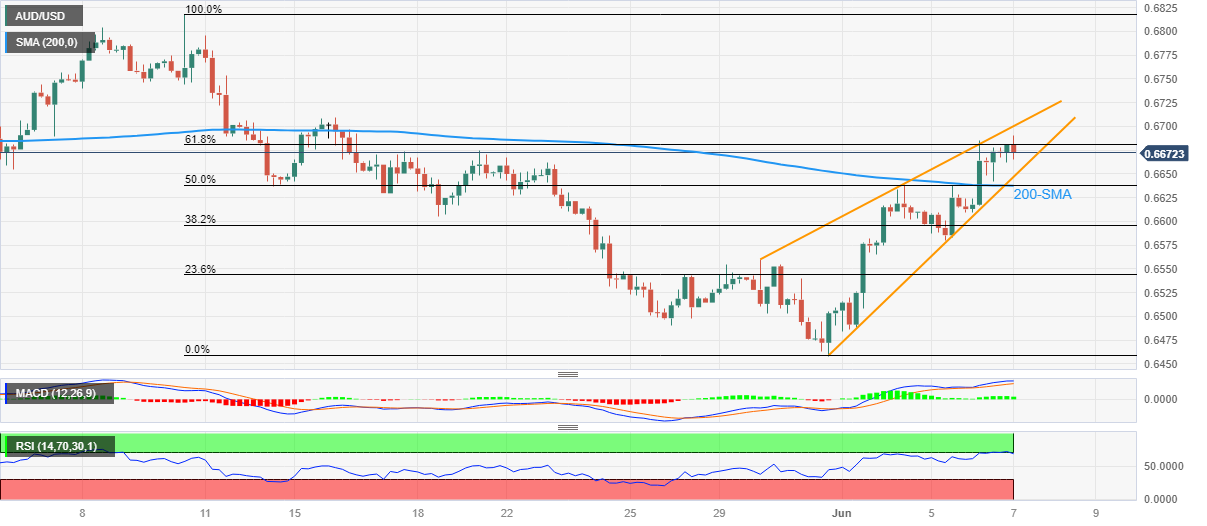
Technically, the Aussie pair portrays a rising wedge bearish chart pattern on the four-hour play while recently reversing from the 61.8% Fibonacci retracement of its May 10-31 downturn, also known as the golden Fibonacci ratio.

That said, the risk-barometer pair’s reversal from the key Fibonacci ratio also justifies the overbought RSI (14) line to tease the sellers.

However, a clear downside break of the stated wedge’s bottom line, close to 0.6650 at the latest, becomes necessary for the AUD/USD bears to retake control.

Even so, a convergence of the 200-SMA and 50% Fibonacci retracement level of around 0.6640-35, appears a tough nut to crack for the AUD/USD sellers.

On the flip side, a successful break of the 61.8% Fibonacci retracement level of 0.6680 needs validation from the stated wedge’s top line, close to the 0.6700 round figure by the press time, to recall the AUD/USD buyers.

Also acting as an upside filter is the mid-May swing high around 0.6710.

AUD/USD: Four-hour chart

Trend: Further downside expected

Additional important levels

Overview
Today last price0.6672
Today Daily Change0.0000
Today Daily Change %0.00%
Today daily open0.6672
 
Trends
Daily SMA200.6613
Daily SMA500.6662
Daily SMA1000.6748
Daily SMA2000.6692
 
Levels
Previous Daily High0.6685
Previous Daily Low0.661
Previous Weekly High0.6639
Previous Weekly Low0.6458
Previous Monthly High0.6818
Previous Monthly Low0.6458
Daily Fibonacci 38.2%0.6656
Daily Fibonacci 61.8%0.6639
Daily Pivot Point S10.6626
Daily Pivot Point S20.658
Daily Pivot Point S30.655
Daily Pivot Point R10.6702
Daily Pivot Point R20.6731
Daily Pivot Point R30.6777

Author

Anil Panchal

Anil Panchal

FXStreet

Anil Panchal has nearly 15 years of experience in tracking financial markets. With a keen interest in macroeconomics, Anil aptly tracks global news/updates and stays well-informed about the global financial moves and their implications.

More from Anil Panchal
Share:

Markets move fast. We move first.

Orange Juice Newsletter brings you expert driven insights - not headlines. Every day on your inbox.

By subscribing you agree to our Terms and conditions.

Editor's Picks

EUR/USD edges above 1.1750 due to ECB-Fed policy divergence

EUR/USD has recovered its recent losses registered in the previous session, trading around 1.1760 during the Asian hours on Friday. Traders will likely observe Germany’s Manufacturing Purchasing Managers’ Index data later in the day.

GBP/USD gathers strength above 1.3450 on Fed rate cut bets, BoE's gradual policy path

The GBP/USD pair gathers strength to around 1.3480 during the early Asian session on Friday. Expectations of the US Federal Reserve rate cuts this year weigh on the US Dollar against the Pound Sterling. Philadelphia Fed President Anna Paulson is set to speak later on the weekend. 

Gold climbs to near $4,350 on Fed rate cut bets, geopolitical risks

Gold price rises to near $4,345 during the early Asian session on Friday. Gold finished 2025 with a significant rally, achieving an annual gain of around 65%, its biggest annual gain since 1979. The rally of the precious metal is bolstered by the prospect of further US interest rate cuts in 2026 and safe-haven flows.

Bitcoin, Ethereum and Ripple enter the New Year with breakout hopes

Bitcoin, Ethereum, and Ripple entered the new year trading at key technical levels on Friday, as traders seek fresh directional cues in January. With BTC locked in a tight range, ETH is approaching its 50-day Exponential Moving Average, while XRP is nearing resistance. A clear breakout across these top three cryptocurrencies could help define market momentum in the opening weeks of the year.

Economic outlook 2026-2027 in advanced countries: Solidity test

After a year marked by global economic resilience and ending on a note of optimism, 2026 looks promising and could be a year of solid economic performance. In our baseline scenario, we expect most of the supportive factors at work in 2025 to continue to play a role in 2026.

Crypto market outlook for 2026

Year 2025 was volatile, as crypto often is.  Among positive catalysts were favourable regulatory changes in the U.S., rise of Digital Asset Treasuries (DAT), adoption of AI and tokenization of Real-World-Assets (RWA).