|

AUD/USD Price Analysis: Prone to sheer downside below 0.6700 despite hawkish RBA

  • AUD/USD has failed to capitalize on the hawkish RBA policy.
  • The RBA continued the 25 bps rate hike spree and pushed the OCR to 3.60%.
  • Australia’s monthly CPI indicator suggests that inflation has peaked.

The AUD/USD pair is displaying a sideways auction in the early European session after a Reserve bank of Australia (RBA)’s monetary policy-inspired volatility. The Aussie asset looks vulnerable above the 0.6700 support despite the upbeat market mood.

In the interest rate decision, RBA Governor Philip Lowe pushed the Official Cash Rate (OCR) by 25 basis points (bps) consecutively for the fifth time to 3.60% to sharpen monetary tools in the battle against persistent Australian inflation. RBA’s Lowe cited “The monthly CPI indicator suggests that inflation has peaked in Australia,” as reported by Reuters.

Further downside in the US Dollar Index (DXY) looks likely amid the absence of recovery signs after printing a fresh day low near 104.16. S&P500 futures have reported more gains, indicating that investors have underpinned the risk-appetite theme.

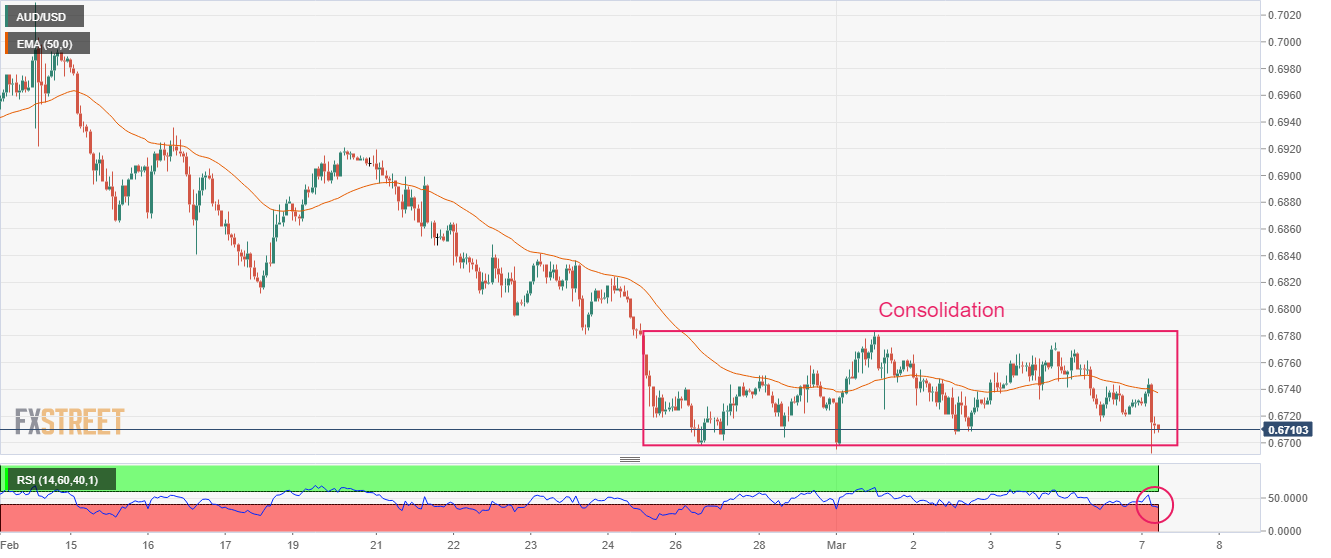
AUD/USD is showing a tad longer consolidation in the range of 0.6700-0.6784 on an hourly scale. The 50-period Exponential Moving Average (EMA) at 0.6737 is acting as a major barricade for the Australian Dollar.

A slippage by the Relative Strength Index (RSI) (14) in the bearish range of 20.00-40.00 is indicating a downside momentum ahead.

A downside move below March 01 low around 0.6700 will drag the Aussie toward December 07 low at 0.6669 and December 20 low at 0.6629.

In an alternate scenario, a confident break above March 01 high at 0.6784 will send the asset toward the round-level resistance at 0.6800 followed by February 06 low at 0.6855.

AUD/USD hourly chart

AUD/USD

Overview
Today last price0.6712
Today Daily Change-0.0015
Today Daily Change %-0.22
Today daily open0.6727
 
Trends
Daily SMA200.6846
Daily SMA500.6899
Daily SMA1000.6754
Daily SMA2000.679
 
Levels
Previous Daily High0.677
Previous Daily Low0.6716
Previous Weekly High0.6784
Previous Weekly Low0.6695
Previous Monthly High0.7158
Previous Monthly Low0.6698
Daily Fibonacci 38.2%0.6737
Daily Fibonacci 61.8%0.6749
Daily Pivot Point S10.6706
Daily Pivot Point S20.6684
Daily Pivot Point S30.6653
Daily Pivot Point R10.6759
Daily Pivot Point R20.6791
Daily Pivot Point R30.6812

Author

Sagar Dua

Sagar Dua

FXStreet

Sagar Dua is associated with the financial markets from his college days. Along with pursuing post-graduation in Commerce in 2014, he started his markets training with chart analysis.

More from Sagar Dua
Share:

Markets move fast. We move first.

Orange Juice Newsletter brings you expert driven insights - not headlines. Every day on your inbox.

By subscribing you agree to our Terms and conditions.

Editor's Picks

EUR/USD edges above 1.1750 due to ECB-Fed policy divergence

EUR/USD has recovered its recent losses registered in the previous session, trading around 1.1760 during the Asian hours on Friday. Traders will likely observe Germany’s Manufacturing Purchasing Managers’ Index data later in the day.

GBP/USD gathers strength above 1.3450 on Fed rate cut bets, BoE's gradual policy path

The GBP/USD pair gathers strength to around 1.3480 during the early Asian session on Friday. Expectations of the US Federal Reserve rate cuts this year weigh on the US Dollar against the Pound Sterling. Philadelphia Fed President Anna Paulson is set to speak later on the weekend. 

Gold climbs to near $4,350 on Fed rate cut bets, geopolitical risks

Gold price rises to near $4,345 during the early Asian session on Friday. Gold finished 2025 with a significant rally, achieving an annual gain of around 65%, its biggest annual gain since 1979. The rally of the precious metal is bolstered by the prospect of further US interest rate cuts in 2026 and safe-haven flows.

Bitcoin, Ethereum and Ripple enter the New Year with breakout hopes

Bitcoin, Ethereum, and Ripple entered the new year trading at key technical levels on Friday, as traders seek fresh directional cues in January. With BTC locked in a tight range, ETH is approaching its 50-day Exponential Moving Average, while XRP is nearing resistance. A clear breakout across these top three cryptocurrencies could help define market momentum in the opening weeks of the year.

Economic outlook 2026-2027 in advanced countries: Solidity test

After a year marked by global economic resilience and ending on a note of optimism, 2026 looks promising and could be a year of solid economic performance. In our baseline scenario, we expect most of the supportive factors at work in 2025 to continue to play a role in 2026.

Crypto market outlook for 2026

Year 2025 was volatile, as crypto often is.  Among positive catalysts were favourable regulatory changes in the U.S., rise of Digital Asset Treasuries (DAT), adoption of AI and tokenization of Real-World-Assets (RWA).