|

AUD/USD Price Analysis: Consolidation is on the horizon as hourly indicators reach oversold conditions

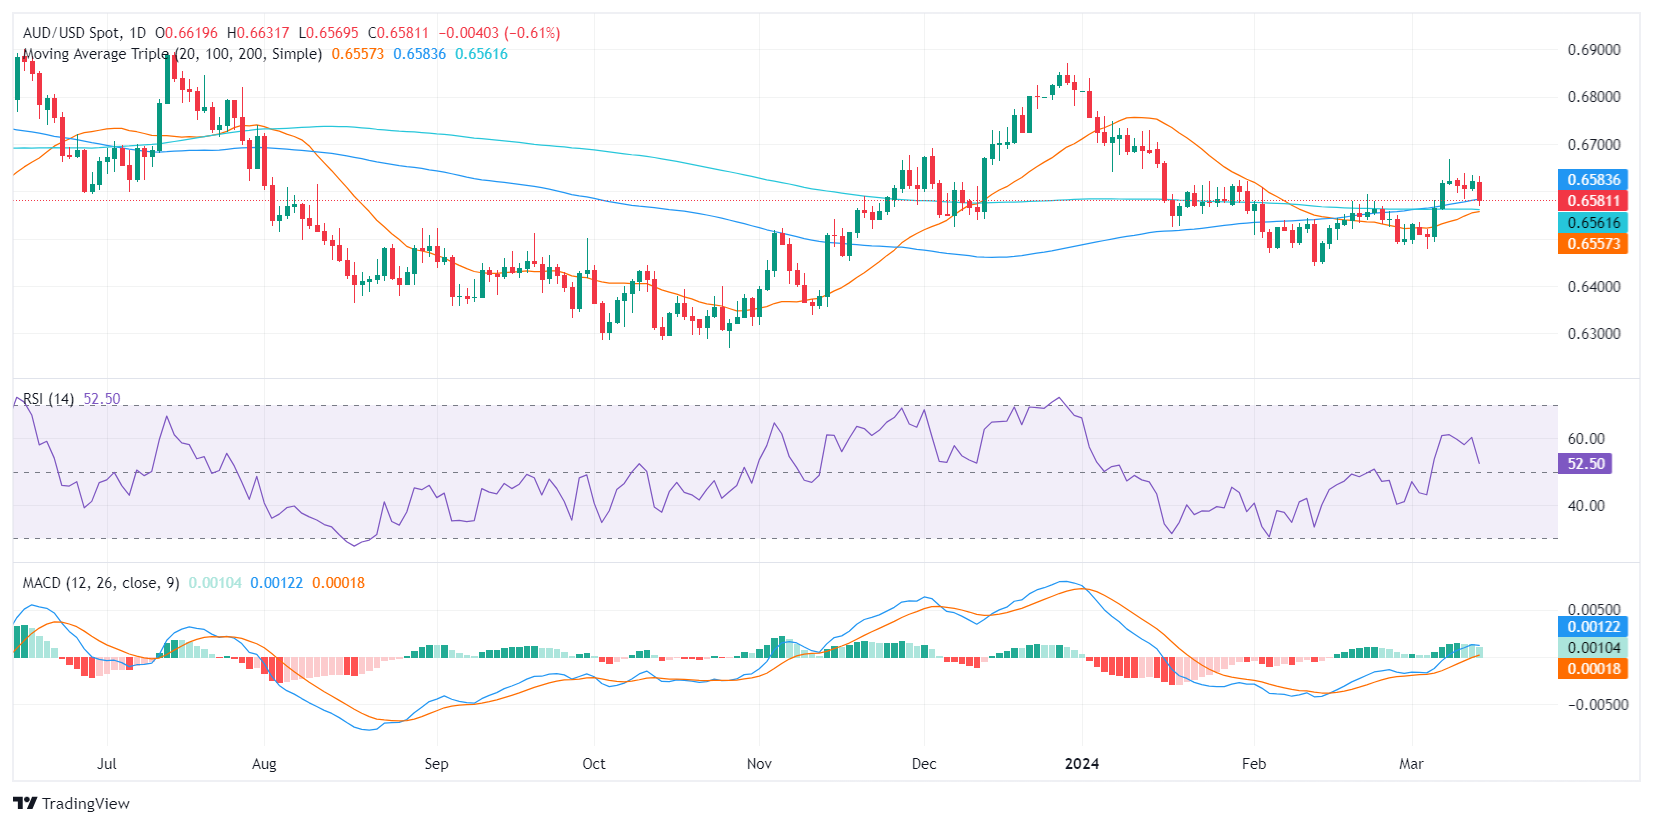
  • The daily RSI remains in positive territory but took a big hit.
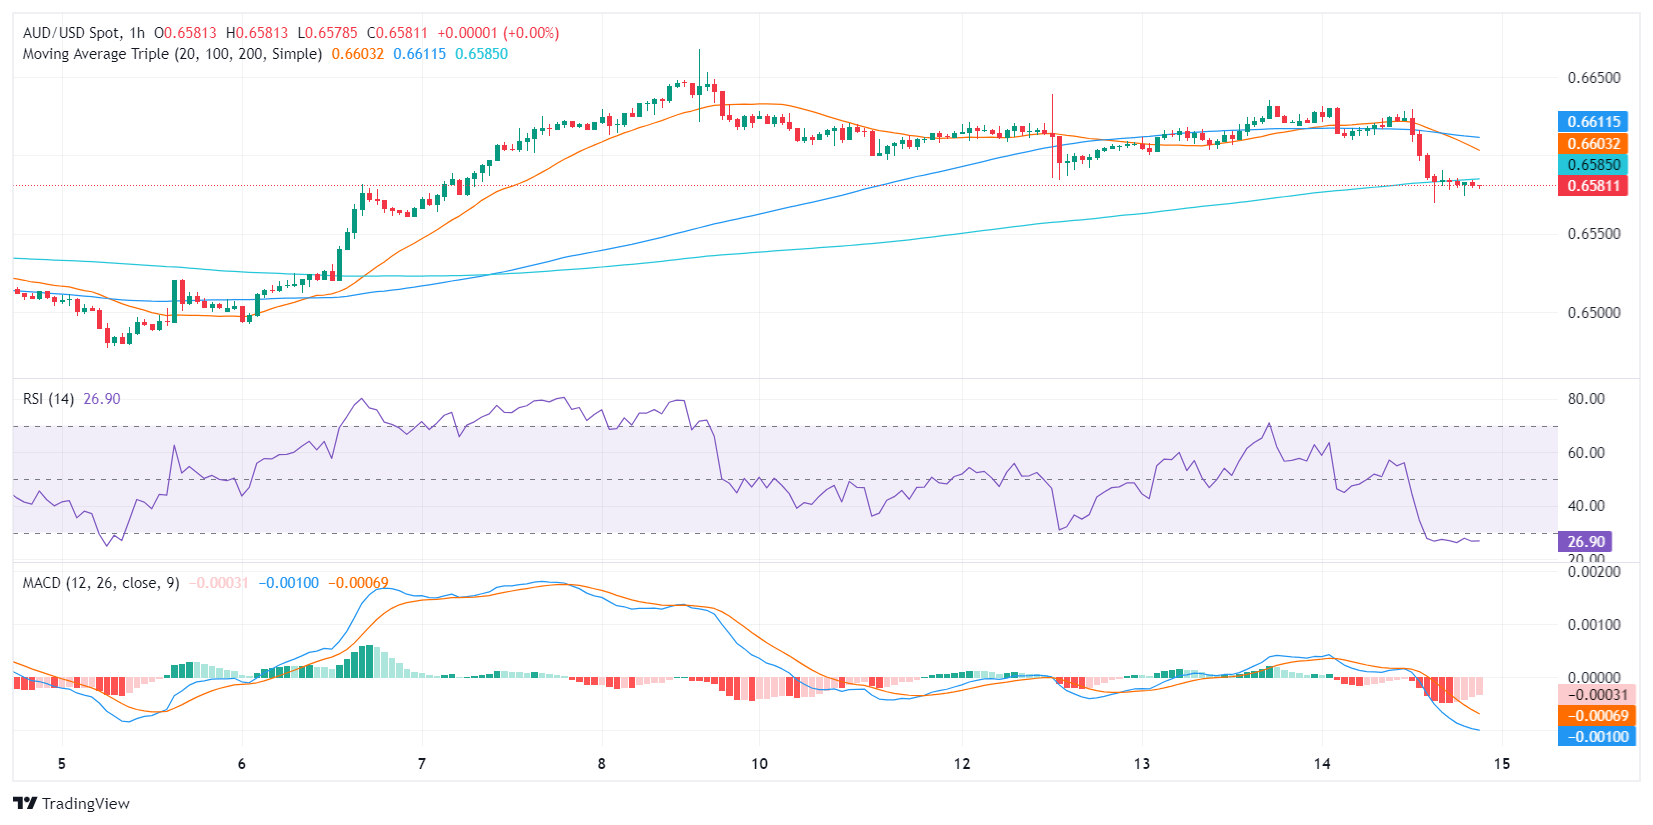
  • The hourly chart shows strong selling pressure with RSI sitting in oversold territory.
  • The pair may consolidate in the short term.

The AUD/USD pair is currently trading at 0.6583, suggesting a noticeable and strong downturn. Regardless of the immediate selling pressure, the broad technical outlook indicates that buyers maintain significant control over the pair. The hourly chart shows strengthening short-term bearish momentum but the selling traction may lose steam after indicators enter in oversold territory.

On the daily chart, the Relative Strength Index (RSI), despite a slight decline, is still in the positive range. The green bars in the Moving Average Convergence Divergence (MACD) show a stable positive momentum, further confirming the dominance of buyers on the larger timeframes.

AUD/USD daily chart

While the daily chart displays evidence of buying momentum, the latest RSI readings on the hourly chart present a contrasting picture with values well below 30. This implies that the AUD/USD is in oversold territory, suggesting an overwhelming dominance of sellers in the market. However, the MACD shows decreasing red bars, indicating a waning bearish momentum in the short term as the sellers might be running out of gas.

AUD/USD hourly chart

Despite the bearish momentum on the hourly chart, the broader outlook remains bullish as the pair continues to trend above the 100 and 200-day SMAs. As for now, the buyers are battling to defend the 20-day average, which in case of losing, will tilt the outlook in favor of the bears for the short term.

AUD/USD

Overview
Today last price0.6581
Today Daily Change-0.0040
Today Daily Change %-0.60
Today daily open0.6621
 
Trends
Daily SMA200.6554
Daily SMA500.6574
Daily SMA1000.6581
Daily SMA2000.6562
 
Levels
Previous Daily High0.6635
Previous Daily Low0.66
Previous Weekly High0.6667
Previous Weekly Low0.6478
Previous Monthly High0.661
Previous Monthly Low0.6443
Daily Fibonacci 38.2%0.6622
Daily Fibonacci 61.8%0.6614
Daily Pivot Point S10.6603
Daily Pivot Point S20.6584
Daily Pivot Point S30.6568
Daily Pivot Point R10.6638
Daily Pivot Point R20.6654
Daily Pivot Point R30.6672

Author

Patricio Martín

Patricio is an economist from Argentina passionate about global finance and understanding the daily movements of the markets.

More from Patricio Martín
Share:

Markets move fast. We move first.

Orange Juice Newsletter brings you expert driven insights - not headlines. Every day on your inbox.

By subscribing you agree to our Terms and conditions.

Editor's Picks

EUR/USD rebounds after falling toward 1.1700

EUR/USD gains traction and trades above 1.1730 in the American session, looking to end the week virtually unchanged. The bullish opening in Wall Street makes it difficult for the US Dollar to preserve its recovery momentum and helps the pair rebound heading into the weekend.

GBP/USD steadies below 1.3400 as traders assess BoE policy outlook

Following Thursday's volatile session, GBP/USD moves sideways below 1.3400 on Friday. Investors reassess the Bank of England's policy oıtlook after the MPC decided to cut the interest rate by 25 bps by a slim margin. Meanwhile, the improving risk mood helps the pair hold its ground.

Gold stays below $4,350, looks to post small weekly gains

Gold struggles to gather recovery momentum and stays below $4,350 in the second half of the day on Friday, as the benchmark 10-year US Treasury bond yield edges higher. Nevertheless, the precious metal remains on track to end the week with modest gains as markets gear up for the holiday season.

Crypto Today: Bitcoin, Ethereum, XRP rebound amid bearish market conditions

Bitcoin (BTC) is edging higher, trading above $88,000 at the time of writing on Monday. Altcoins, including Ethereum (ETH) and Ripple (XRP), are following in BTC’s footsteps, experiencing relief rebounds following a volatile week.

How much can one month of soft inflation change the Fed’s mind?

One month of softer inflation data is rarely enough to shift Federal Reserve policy on its own, but in a market highly sensitive to every data point, even a single reading can reshape expectations. November’s inflation report offered a welcome sign of cooling price pressures. 

XRP rebounds amid ETF inflows and declining retail demand demand

XRP rebounds as bulls target a short-term breakout above $2.00 on Friday. XRP ETFs record the highest inflow since December 8, signaling growing institutional appetite.