AUD/USD Price Analysis: Bearish flag pattern spotted on hourly charts ahead of RBA on Tuesday
- AUD/USD regains positive traction on Monday, albeit lacks follow-through buying.
- Bets for one more Fed rate hike in 2023 cap the pair ahead of the RBA on Tuesday.
- The formation of a bearish flag on hourly charts warrants caution for bullish traders.

The AUD/USD pair attracts some dip-buying near the 0.6440 area or a four-day low touched during the Asian session on Monday and stalls last week's modest pullback from the 0.6520 region, or its highest level since August 11. Spot prices currently trade near the 0.6465 zone, up just over 0.10% for the day, and draw support from subdued US Dollar (USD) price action.
The mixed US monthly employment details released on Friday ensure that the Fed will leave rates unchanged at its September meeting and fails to assist the USD to capitalize on Friday's strong move up closer to the August monthly swing high. This, in turn, is seen as a key factor acting as a tailwind for the AUD/USD pair. The markets, however, are still pricing in the possibility of one more 25 bps lift-off by the end of this year. This might hold back traders from placing aggressive bearish bets around the USD and keep a lid on the major ahead of the Reserve Bank of Australia (RBA) monetary policy meeting on Tuesday.
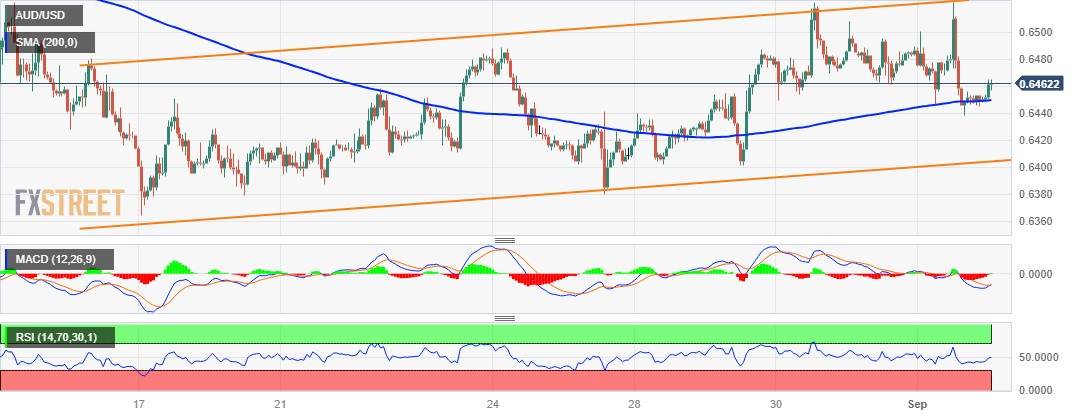
From a technical perspective, the AUD/USD pair's recent bounce from the 0.6365 area, or the YTD low touched in August, has been along an upward-sloping channel. Against the backdrop of a sharp downfall from the double-top resistance near the 0.6900 mark, this constitutes the formation of a bearish flag pattern on hourly charts. Moreover, oscillators on the daily chart - though have managed to recover from lower levels - are still holding in the negative territory. This suggests that the path of least resistance for spot prices is to the downside and any subsequent move up might still be seen as an opportunity for bearish traders.
Meanwhile, the 200-hour Simple Moving Average (SMA), currently pegged around the mid-0.6400s, is likely to act as a pivotal point for intraday traders. Acceptance below will expose the trend-channel support near the 0.6400 mark, which if broken decisively will mark a fresh breakdown and pave the way for deeper losses. The AUD/USD pair might then accelerate the slide back towards the YTD low, around the 0.6365 region, before eventually dropping to the 0.6300 round figure.
On the flip side, the 0.6500 psychological mark now seems to act as an immediate hurdle ahead of the top end of the aforementioned channel, around the 0.6520-0.6525 region. A convincing breakthrough will negate the bearish setup and prompt an aggressive short-covering move. The AUD/USD pair might then aim to reclaim the 0.6500 round figure. Some follow-through buying beyond and testing the 0.6510-0.6515 resistance zone might shift the bias in favour of bullish traders and pave the way for a further near-term positive move towards the 0.6700 mark en route to the next relevant hurdle near the 0.6725-0.6730 area.
ADU/USD 1-hour chart
Technical levels to watch
Author

Haresh Menghani
FXStreet
Haresh Menghani is a detail-oriented professional with 10+ years of extensive experience in analysing the global financial markets.


