|

AUD/USD price analysis: Australian dollar trading in a triangle pattern near 0.6830 level

  • The aussie is off daily lows after being under relative bearish pressure earlier in the session.
  • The level to beat for sellers is the 0.6821/14 support zone.
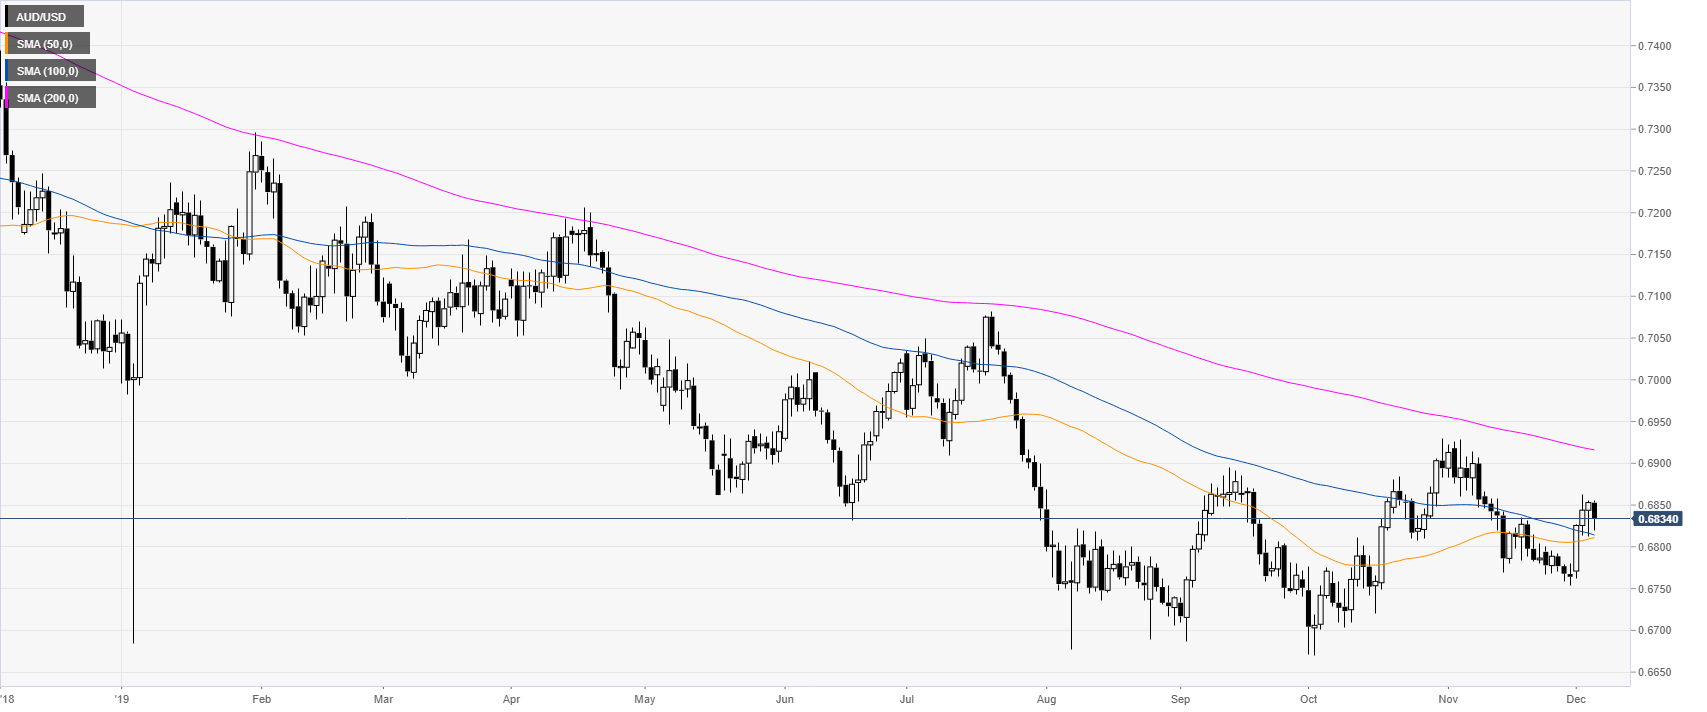


AUD/USD daily chart 

 
AUD/USD is trading in a downtrend below its 200-day simple moving average (DMA). However, the spot had a bounce near the 0.6850 level above the 50 and 100 DMAs. 
 

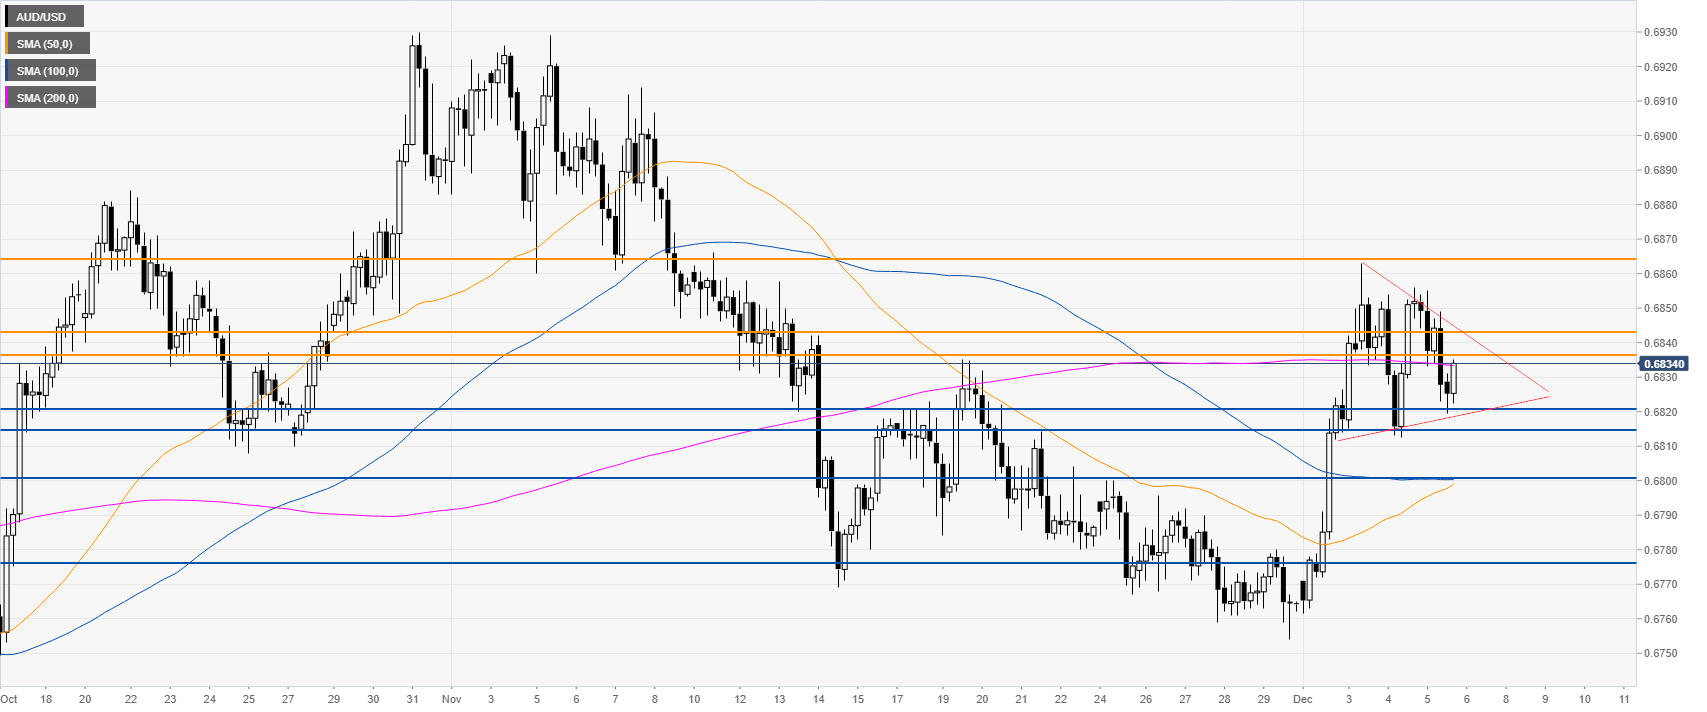
AUD/USD four-hour chart

 
The aussie is consolidating the recent gains in a triangle pattern around the 200 SMA. In the New York session, the market is trading below the 0.6836/43 resistance zone. However, if the market happens to pierce this zone, the quote could climb to the 0.6864 level, according to the Technical Confluences Indicator
 

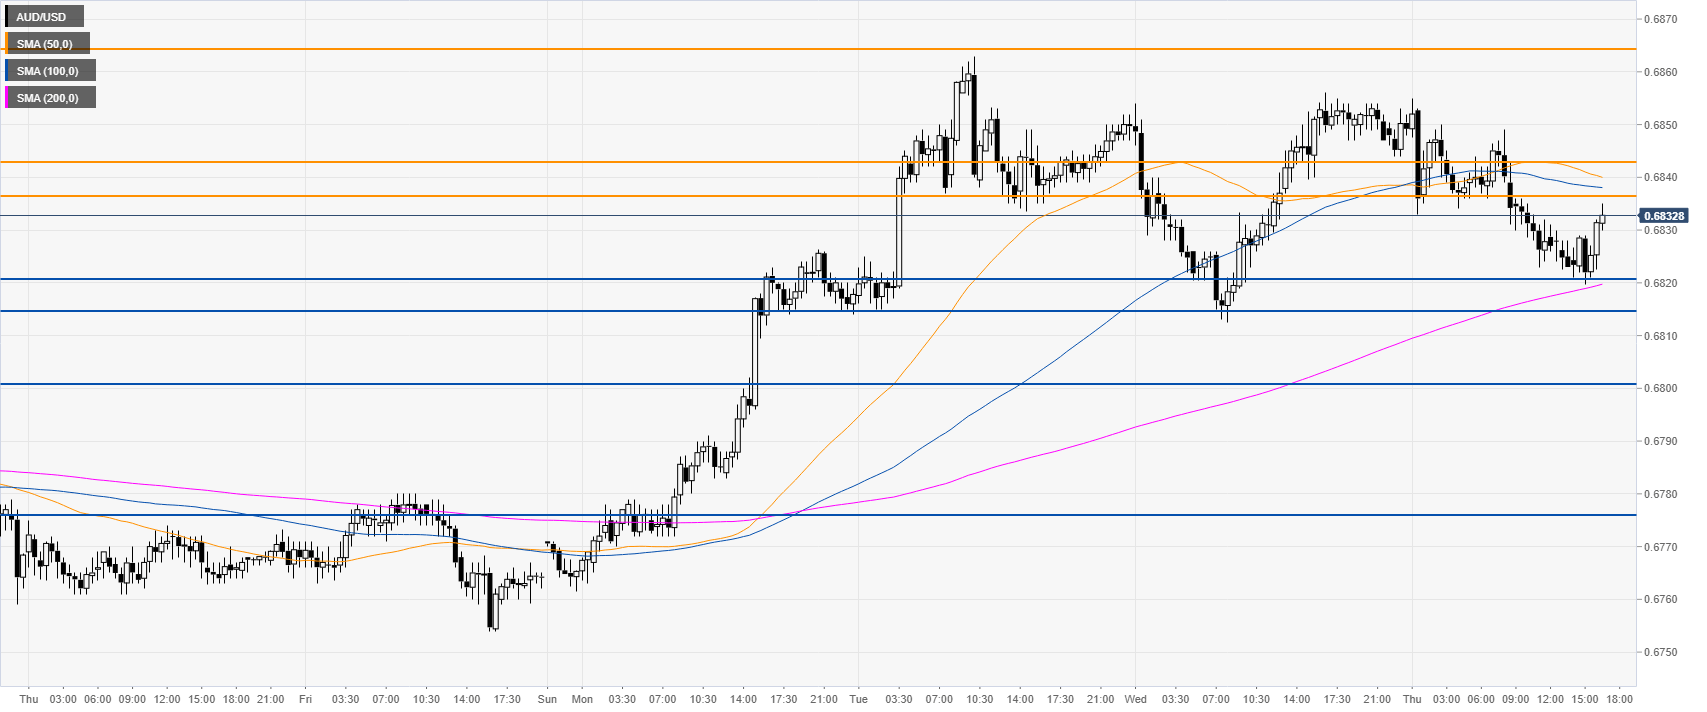
AUD/USD 30-minute chart 

 
AUD/USD is off the daily lows while trading above the 200 SMA but below the 50/100 SMAs, suggesting a consolidation in the near. As the underlying trend remains bearish, the sellers could try to break the 0.6821/14 support zone. Further down lie the 0.6800, 0.6779 and 0.6775 level.
 

Additional key levels

AUD/USD

Overview
Today last price0.6834
Today Daily Change-0.0019
Today Daily Change %-0.28
Today daily open0.6853
 
Trends
Daily SMA200.6815
Daily SMA500.6809
Daily SMA1000.6816
Daily SMA2000.6917
 
Levels
Previous Daily High0.6856
Previous Daily Low0.6812
Previous Weekly High0.68
Previous Weekly Low0.6754
Previous Monthly High0.6929
Previous Monthly Low0.6754
Daily Fibonacci 38.2%0.6839
Daily Fibonacci 61.8%0.6829
Daily Pivot Point S10.6825
Daily Pivot Point S20.6797
Daily Pivot Point S30.6782
Daily Pivot Point R10.6869
Daily Pivot Point R20.6884
Daily Pivot Point R30.6912

Author

Flavio Tosti

Flavio Tosti

Independent Analyst


More from Flavio Tosti
Share:

Editor's Picks

EUR/USD treads water above 1.1850 amid thin trading

EUR/USD stays defensive but holds 1.1850 amid quiet markets in the European hours on Monday.  The US Dollar is struggling for direction due to thin liquidity conditions as US markets are closed in observance of Presidents' Day. 

GBP/USD flat lines as traders await key UK and US macro data

GBP/USD kicks off a new week on a subdued note and oscillates in a narrow range near 1.365 in Monday's European trading. The mixed fundamental backdrop warrants some caution for aggressive traders as the market focus now shifts to this week's important releases from the UK and the US.

Gold sticks to intraday losses; lacks follow-through

Gold remains depressed through the early European session on Monday, though it has managed to rebound from the daily trough and currently trades around the $5,000 psychological mark. Moreover, a combination of supporting factors warrants some caution for aggressive bearish traders, and before positioning for deeper losses.

Bitcoin, Ethereum and Ripple consolidate within key ranges as selling pressure eases

Bitcoin and Ethereum prices have been trading sideways within key ranges following the massive correction. Meanwhile, XRP recovers slightly, breaking above the key resistance zone. The top three cryptocurrencies hint at a potential short-term recovery, with momentum indicators showing fading bearish signs.

Global inflation watch: Signs of cooling services inflation

Realized inflation landed close to expectations in January, as negative base effects weighed on the annual rates. Remaining sticky inflation is largely explained by services, while tariff-driven goods inflation remains limited even in the US.

Ripple Price Forecast: XRP potential bottom could be in sight

Ripple edges up above the intraday low of $1.35 at the time of writing on Friday amid mixed price actions across the crypto market. The remittance token failed to hold support at $1.40 the previous day, reflecting risk-off sentiment amid a decline in retail and institutional sentiment.