|

AUD/USD Price Analysis: Aussie drifting down to fresh 2020 lows

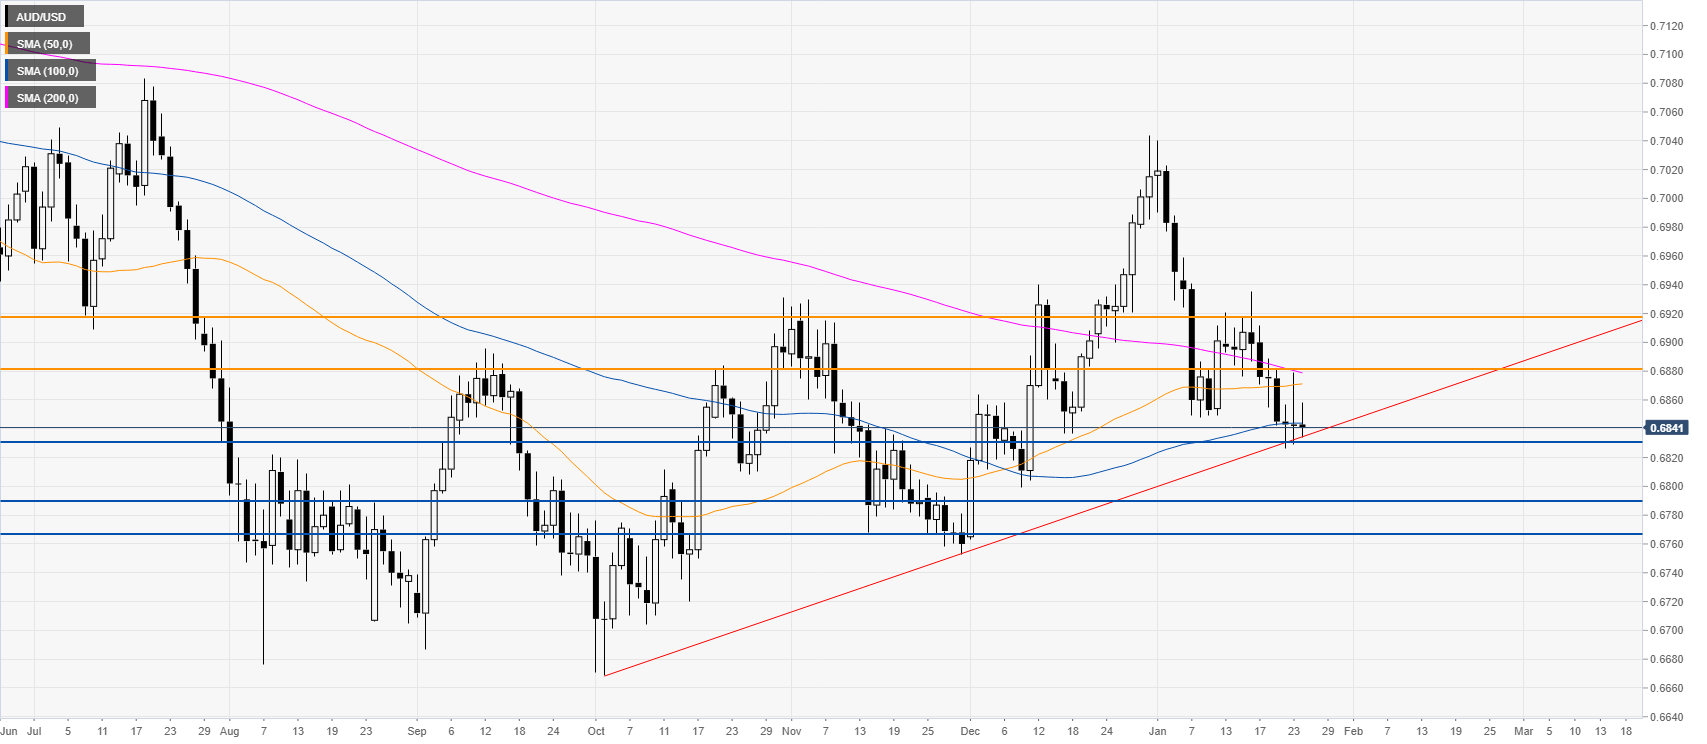
  • AUD/USD is breaking below the 0.6831 support.
  • Downside targets can be seen near 0.6790 and 0.6767 levels. 


AUD/USD daily chart

 
AUD/USD is under bearish pressure falling to new January lows while trading below the main daily simple moving averages (SMAs) suggesting an underlying bearish bias. The market is breaking below an ascending trendline. The market is starting to pierce below the 0.6831 support. A daily close below this level can see further downside towards the 0.6790 and 0.6767 levels, according to the Technical Confluences Indicator. Resistance is seen at the 0.6892 and 0.6918 level.s 
 

Additional key levels 

AUD/USD

Overview
Today last price0.6821
Today Daily Change-0.0021
Today Daily Change %-0.31
Today daily open0.6842
 
Trends
Daily SMA200.6914
Daily SMA500.6871
Daily SMA1000.6844
Daily SMA2000.6881
 
Levels
Previous Daily High0.6879
Previous Daily Low0.6829
Previous Weekly High0.6935
Previous Weekly Low0.6871
Previous Monthly High0.7033
Previous Monthly Low0.6762
Daily Fibonacci 38.2%0.6848
Daily Fibonacci 61.8%0.686
Daily Pivot Point S10.6821
Daily Pivot Point S20.68
Daily Pivot Point S30.6771
Daily Pivot Point R10.6871
Daily Pivot Point R20.69
Daily Pivot Point R30.6921

Author

Flavio Tosti

Flavio Tosti

Independent Analyst


More from Flavio Tosti
Share:

Editor's Picks

EUR/USD tests nine-day EMA support near 1.1850

EUR/USD inches lower during the Asian hours on Monday, trading around 1.1870 at the time of writing. The 14-day Relative Strength Index momentum indicator at 56 stays above the midline, confirming improving momentum. RSI has cooled from prior overbought readings but stabilizes above 50, suggesting dips could stay limited before buyers reassert control.

GBP/USD flat lines as traders await key UK macro data and FOMC minutes

The GBP/USD pair kicks off a new week on a subdued note and oscillates in a narrow range, just below mid-1.3600s, during the Asian session. Moreover, the mixed fundamental backdrop warrants some caution for aggressive traders as the market focus now shifts to this week's important releases from the UK and the US.

Gold slides below $5,000 amid USD uptick and positive risk tone; downside seems limited

Gold attracts fresh sellers at the start of a new week and reverses a part of Friday's strong move up of over $150 from sub-$4,900 levels. The commodity slides back below the $5,000 psychological mark during the Asian session, though the downside potential seems limited amid a combination of supporting factors.

Bitcoin, Ethereum and Ripple consolidate within key ranges as selling pressure eases

Bitcoin and Ethereum prices have been trading sideways within key ranges following the massive correction. Meanwhile, XRP recovers slightly, breaking above the key resistance zone. The top three cryptocurrencies hint at a potential short-term recovery, with momentum indicators showing fading bearish signs.

Global inflation watch: Signs of cooling services inflation

Realized inflation landed close to expectations in January, as negative base effects weighed on the annual rates. Remaining sticky inflation is largely explained by services, while tariff-driven goods inflation remains limited even in the US.

Ripple Price Forecast: XRP potential bottom could be in sight

Ripple edges up above the intraday low of $1.35 at the time of writing on Friday amid mixed price actions across the crypto market. The remittance token failed to hold support at $1.40 the previous day, reflecting risk-off sentiment amid a decline in retail and institutional sentiment.