|

AUD/NZD price analysis: Cross struggles to hold gains amid mixed signals

  • AUD/NZD trades near the 1.0900 zone with minor losses on Friday.
  • The pair maintains a bullish outlook despite mixed short-term signals.
  • Key support is clustered below 1.0880, with resistance near 1.0920.

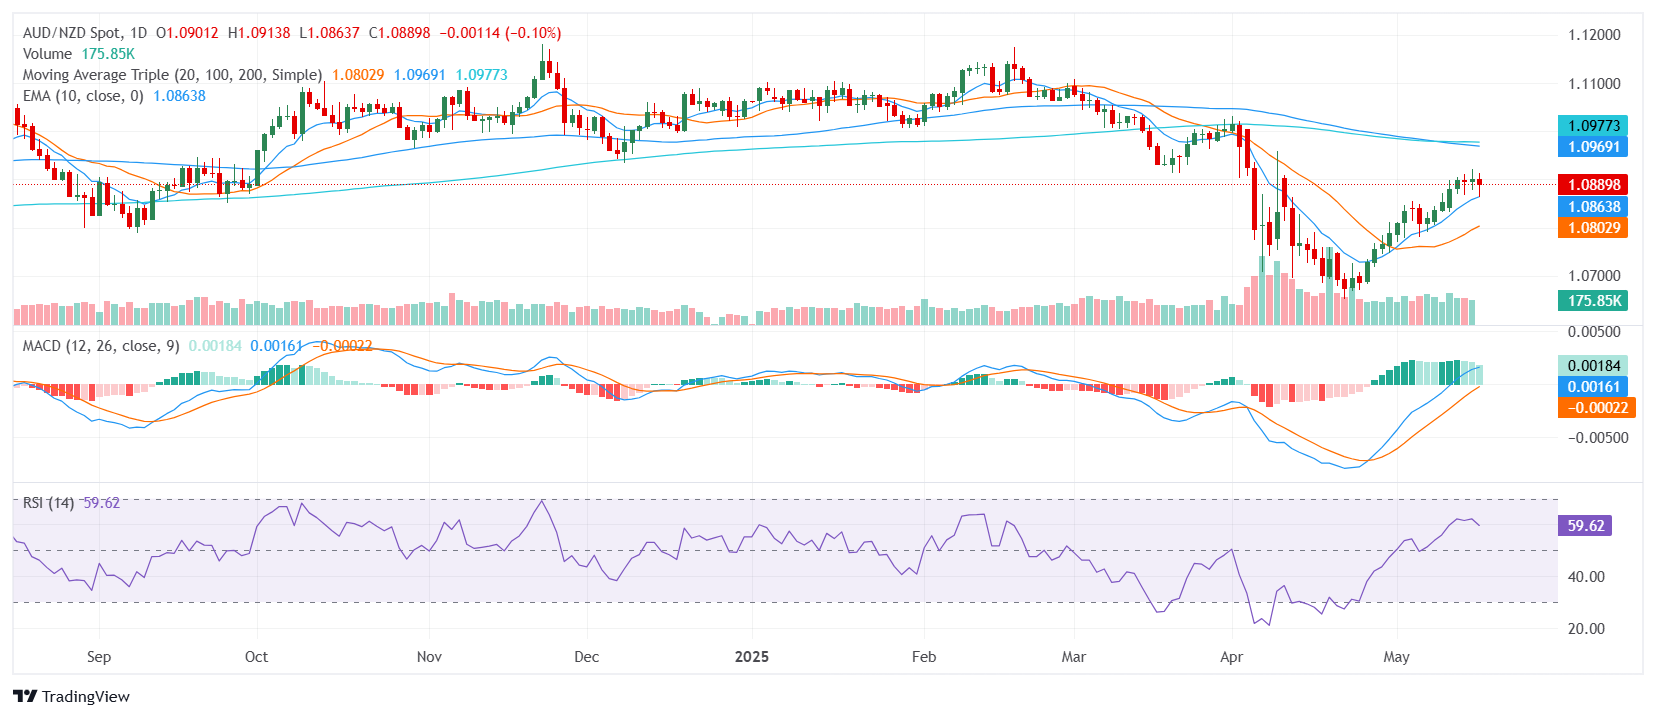
The AUD/NZD pair is experiencing mild selling pressure on Friday, hovering near the 1.0900 zone as the market approaches the Asian session. Despite the minor losses, the broader technical outlook remains constructive, with several key indicators aligning to support the pair's upward trajectory. However, conflicting short-term signals suggest that further gains may face headwinds, as traders navigate a mix of buy and sell pressures.

AUD/NZD maintains a generally bullish structure, supported by the alignment of short-term moving averages. The 20-day Simple Moving Average (SMA) indicates a buy signal, reflecting the pair's recent strength, while both the 10-day Exponential Moving Average (EMA) and the 10-day SMA similarly point to upward momentum. However, the broader trend picture remains mixed, as the longer-term 100-day and 200-day SMAs still favor selling, highlighting the potential for deeper pullbacks if bullish momentum falters.

Momentum indicators provide a similarly divided outlook. The Relative Strength Index (RSI) hovers around the 50 level, indicating neutral conditions that align with the current price consolidation. Meanwhile, the Moving Average Convergence Divergence (MACD) signals buy momentum, reinforcing the broader bullish view. In contrast, the Stochastic %K, trading in the 80s, and the Stochastic RSI Fast, positioned in the 90s, both suggest overbought conditions, indicating the potential for near-term corrective moves. The Bull Bear Power, sitting near neutral, further highlights this lack of a decisive trend.

For now, immediate support is expected around 1.0871, with additional levels near 1.0867 and 1.0864. On the upside, resistance is likely to emerge around 1.0914, followed closely by 1.0923 and 1.0945, potentially capping any recovery attempts as the pair struggles to maintain its recent gains.

Daily Chart
Author

Patricio Martín

Patricio is an economist from Argentina passionate about global finance and understanding the daily movements of the markets.


More from Patricio Martín
Share:

Editor's Picks

GBP/USD keeps the firm tone above 1.3600

GBP/USD clings to its daily gains, although it gives back some of them and recedes toward the 1.3630-1.3620 band on Thursday. Cable’s uptick comes despite the modest bounce in the Greenback, while investors gear up for key data releases on the UK calendar on Friday.

EUR/USD treads water near 1.1670

EUR/USD gives away all its initial gains and receded to the sub-1.1700 region. The US Dollar’s late recovery has dragged the pair lower, leaving it practically unchanged following the NA session on Thursday. In the meantime, investors gear up for the release of preliminary S&P Global Manufacturing and Services PMIs on both sides of the Atlantic on Friday.

Gold trims losses, back above $4,500

Gold manages to regain some composure and reclaim the area beyond the key $4,500 mark per troy ounce on Thursday. The yellow metal’s daily decline comes amid the humble improvement in the US Dollar while US Treasury yields remain on the rise following Wednesday’s marked retracement across the curve.

XRP extends rally as bullish technical signals underpin breakout attempt

Ripple holds in bullish hands, as price action extends above $1.16 at the time of writing on Thursday. Since Monday, the cross-border remittance token has surged by more than 20%, reflecting a steady growth in risk-on sentiment. The broader crypto market sentiment is on an upward roll at 62 in the Greed territory on Thursday, up from 46 the previous day, according to the Fear & Greed Index.

US Treasury doubles long-dated bond buybacks: Why are yields rising again?

US Treasury yields stabilize on Thursday after Wednesday’s sharp decline, with the 10-year yield edging back up to 4.672%. The US Treasury doubled the size of some long-dated debt buybacks, a surprise decision that helped ease the recent surge in yields.

$20 billion offered, $2 billion taken: Why Treasury doubled its buyback cap

The US Treasury moved off its own calendar on Wednesday, and that is the part worth sitting with. At 12:32 GMT, the department said it would at least double the size of liquidity support buyback operations in the 10-year to 20-year and 20-year to 30-year sectors, lifting the maximum from $2 billion per operation to at least $4 billion, effective September 9 and running to November 4.














