AUD/NZD Price Analysis: Aussie holds near 1.0900 as bullish momentum persists
- AUD/NZD trades near the 1.0900 zone after modest gains in Monday’s session.
- Short-term indicators support the bullish bias despite mixed longer-term signals.
- Key support levels hold below, while resistance aligns near recent highs.

The AUD/NZD pair edged higher on Monday, trading near the 1.0900 zone after the European session, reflecting a steady bullish tone as the market heads into the Asian session. Price action remains within the middle of its daily range, suggesting that buyers maintain control despite some longer-term resistance levels. The immediate outlook is supported by rising short-term averages, though broader challenges remain.
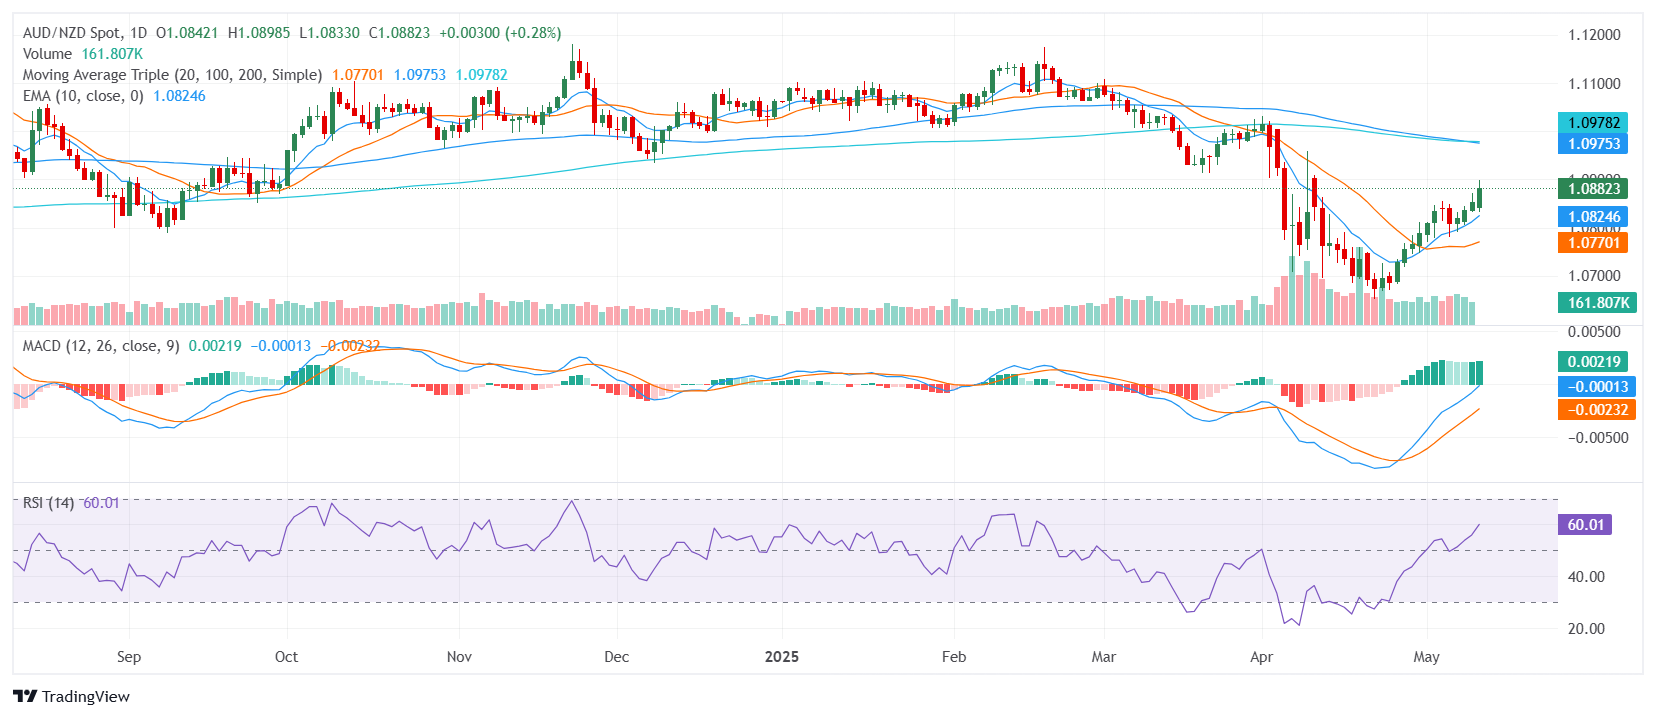
From a technical perspective, the pair is flashing a bullish overall signal. The Relative Strength Index sits in the 50s, indicating balanced momentum without immediate overbought conditions. The Moving Average Convergence Divergence confirms the broader uptrend with a buy signal, reinforcing the positive tone. Meanwhile, the Bull Bear Power remains near neutral, reflecting stable short-term conditions, while both the Stochastic %K and Williams Percent Range also indicate neutral momentum, suggesting the pair is not yet overextended.
Short-term trend indicators align with the bullish sentiment. The 10-day Exponential and Simple Moving Averages, both positioned near current price levels, are trending higher and provide immediate dynamic support. The 20-day Simple Moving Average also supports the bullish outlook, further reinforcing the broader uptrend. However, the longer-term 100-day and 200-day Simple Moving Averages remain above current levels, suggesting that broader selling pressure may still cap gains in the medium term.
Support is located at 1.0867, 1.0854, and 1.0828. Resistance is found at 1.0879, 1.0925, and 1.0947. A break above the immediate resistance zone could confirm a broader breakout, while a move below support might trigger a short-term correction, potentially testing the lower end of the recent range.
Daily Chart
Author

Patricio Martín
FXStreet
Patricio is an economist from Argentina passionate about global finance and understanding the daily movements of the markets.