|

AUD/NZD Price Analysis: Aussie holds near 1.0800 as bullish signals persist

  • AUD/NZD trades near the 1.0800 zone after modest gains in Friday’s session.
  • Short-term indicators favor buyers, despite mixed longer-term signals.
  • Key support levels hold below, while resistance aligns near recent highs.

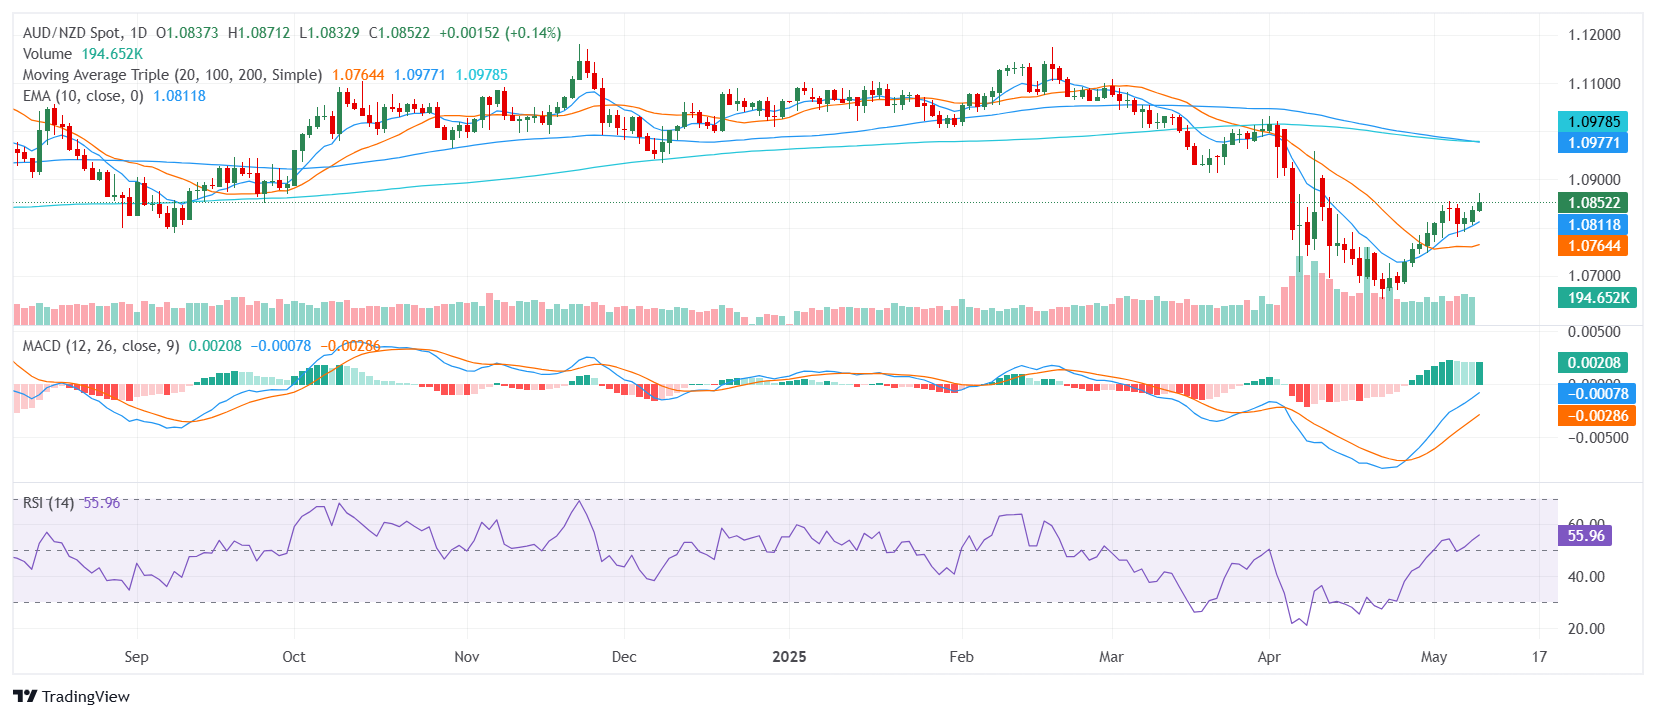
The AUD/NZD pair edged higher on Friday, trading near the 1.0800 zone after the European session, reflecting a steady bullish tone as the market heads into the Asian session. Price action remains within the middle of the day’s range, suggesting that buyers maintain control despite some longer-term resistance levels. The immediate outlook is supported by rising short-term averages, though broader challenges remain.

From a technical perspective, the pair is flashing a bullish overall signal. The Relative Strength Index remains neutral near 55, indicating balanced momentum without immediate overbought conditions. The Moving Average Convergence Divergence confirms the broader uptrend with a buy signal, reinforcing the positive tone. Meanwhile, the Bull Bear Power and Ultimate Oscillator are both neutral, highlighting the absence of extreme momentum in either direction.

The short-term trend structure is supportive of further gains. The 10-day and 20-day Simple Moving Averages, positioned below the current price, both slope upward, providing dynamic support for the ongoing uptrend. However, the longer-term 100-day and 200-day Simple Moving Averages remain above current levels and continue to trend lower, suggesting that broader selling pressure may still limit the upside over the medium term.

Support is located at 1.0837, 1.0825, and 1.0811. Resistance is found at 1.0866, 1.0883, and 1.0925. A break above the immediate resistance zone could confirm a broader breakout, while a move below support might trigger a short-term correction, potentially testing the lower end of the recent range.

Daily Chart
Author

Patricio Martín

Patricio is an economist from Argentina passionate about global finance and understanding the daily movements of the markets.


More from Patricio Martín
Share:

Editor's Picks

GBP/USD flirts with tops near 1.3470

GBP/USD manages to regain composure and challenge the area of daily highs around 1.3470 on Friday. Cable picks up pace despite marginal gains in the Greenback in a context of swelling geopolitical tensions and rising global oil prices.

EUR/USD struggles above 1.1500 despite USD weakness

EUR/USD struggles with its recovery above 1.1500 in European trading on Monday, despite broad US Dollar weakness and improved risk sentiment. The USD loses traction following US President Trump's call off an attack on Iran and that talks between the two sides would happen on Monday. Traders will closely monitor the developments surrounding US-Iran negotiations and US ISM PMI data.

Gold extends range play below $4,100 as rebounding USD meets receding Fed hike bets

Gold struggles to capitalize on a modest weekly bullish gap opening, and remains below the $4,100 mark heading into the European session. The US Dollar stages a modest recovery from its lowest level since June 17, which is seen capping the upside for the commodity. The upside for the USD, however, seems limited amid renewed hopes for a US-Iran peace deal and receding US Fed rate-hike expectations.

Week ahead: US payrolls report and AI earnings to keep investors on edge

After the Fed decision, NFP report awaited for more rate hike clues. Employment also on the agenda in Canada and New Zealand. Chinese trade and Japanese wage data to be watched too. But Iran and AI headlines to remain in driver’s seat for risk sentiment.

Solana risks a steeper decline below $70 despite steady ETF inflows

Solana (SOL) is trading in the red, losing bullish momentum and remaining capped below its 50-day Exponential Moving Average at $75.68. SOL-focused Exchange Traded Funds show resilience with a monthly inflow of $14.62 million in July, while the near-term retail support wanes with the funding rate turning negative.

9-3: Is the Federal Reserve’s vote tally Warsh's new forward guidance?
The rate did not move. Neither did the statement, and that’s the more interesting fact. Set the July 29 Federal Open Market Committee (FOMC) statement beside the one issued on June 17, and the two documents are identical apart from a single verb and a paragraph at the bottom naming three dissenters.














