|

AUD/NZD Price Analysis: 200-EMA a key support for aussie bulls

  • A lucid trend reversal shown by AUD/NZD has underpinned the kiwi bulls.
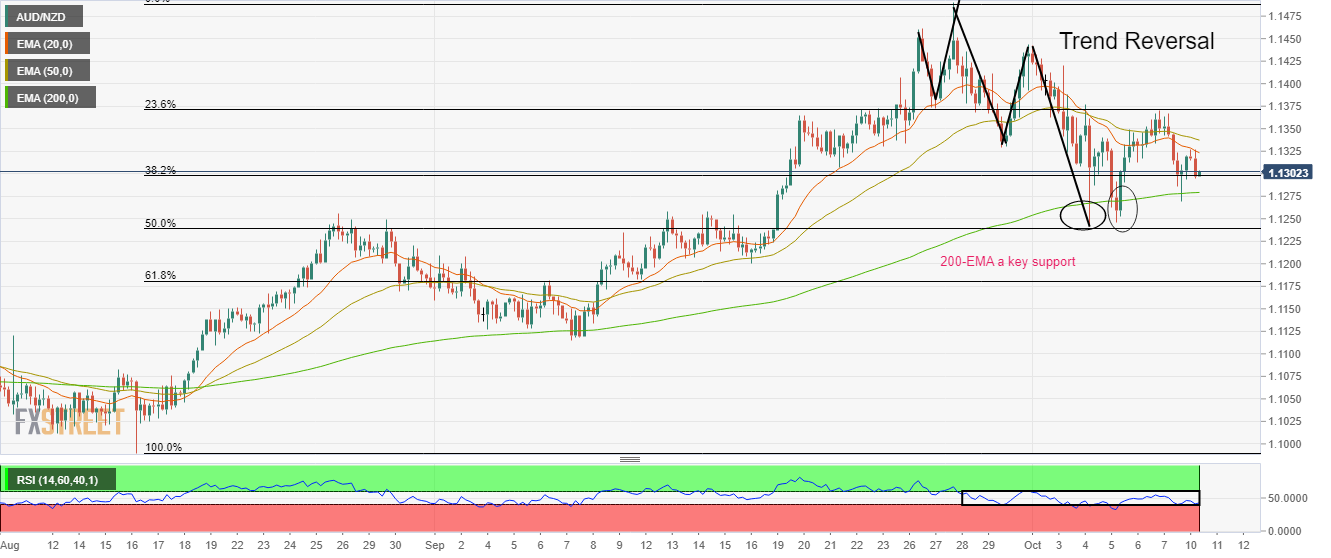
  • The 200-EMA is acting as a major cushion for the counter.
  • The RSI (14) will trigger a downside momentum if drops into the bearish range of 20.00-40.00.

The AUD/NZD pair has dropped below 1.1300 in Tokyo as strength in the downside bias has picked up. The cross is declining from the late New York session after facing severe hurdles around 1.1320. Widened divergence in the Reserve Bank of Australia (RBA)-Reserve Bank of New Zealand (RBNZ) policy is continuously impacting the aussie bulls.

On a four-hour scale, the formation of lower highs and lower lows has confirmed the trend reversal, which will compel the market participants to ‘sell rise’. The aussie bulls have sensed temporary demand from the mighty 200-period Exponential Moving Average (EMA) a few times. The cushion of 200-EMA is critical for the cross and price movement near the same will determine further direction.

A bearish crossover, represented by the 20-and 50-period EMAs at 1.1363 add to the downside filters.

Apart from that, the Relative Strength Index (RSI) (14) has shifted into the 40.00-60.00 range from the bullish range of 60.00-80.00, which indicates that kiwi bulls are not bearish anymore by the time. A breakdown of the momentum oscillator into the bearish range of 20.00-40.00 will trigger the downside momentum.

The kiwi bulls will strengthen if the cross surrenders the 50% Fibo retracement placed at 1.1240, which will drag the asset towards the round-level support at 1.1200, followed by 61.8% Fibo retracement at 1.1180.

Alternatively, a break above 23.6% Fibo retracement around 1.1375 will drive the asset towards September 30 high at 1.1440. A breach of the latter will send the asset toward September 26 high at 1.1462.

AUD/NZD four-hour chart

AUD/NZD

Overview
Today last price1.1302
Today Daily Change-0.0019
Today Daily Change %-0.17
Today daily open1.1321
 
Trends
Daily SMA201.1333
Daily SMA501.1208
Daily SMA1001.1131
Daily SMA2001.0965
 
Levels
Previous Daily High1.1367
Previous Daily Low1.1269
Previous Weekly High1.1443
Previous Weekly Low1.1241
Previous Monthly High1.1491
Previous Monthly Low1.1115
Daily Fibonacci 38.2%1.1306
Daily Fibonacci 61.8%1.1329
Daily Pivot Point S11.1271
Daily Pivot Point S21.1221
Daily Pivot Point S31.1174
Daily Pivot Point R11.1369
Daily Pivot Point R21.1416
Daily Pivot Point R31.1466

Author

Sagar Dua

Sagar Dua

FXStreet

Sagar Dua is associated with the financial markets from his college days. Along with pursuing post-graduation in Commerce in 2014, he started his markets training with chart analysis.

More from Sagar Dua
Share:

Markets move fast. We move first.

Orange Juice Newsletter brings you expert driven insights - not headlines. Every day on your inbox.

By subscribing you agree to our Terms and conditions.

Editor's Picks

EUR/USD could test 1.1750 amid strengthening bullish bias

EUR/USD remains flat after two days of small losses, trading around 1.1740 during the Asian hours on Thursday. On the daily chart, technical analysis indicates a strengthening of a bullish bias, as the pair continues to trade within an ascending channel pattern.

GBP/USD consolidates above mid-1.3300s as traders await BoE and US CPI report

The GBP/USD pair struggles to capitalize on the overnight bounce from the 1.3310 area, or a one-week low, and oscillates in a narrow band during the Asian session on Thursday. Spot prices currently trade around the 1.3370 region, down less than 0.10% for the day, as traders opt to wait on the sidelines ahead of the key central bank event risk and US consumer inflation data.

Gold awaits weekly trading range breakout ahead of US CPI report

Gold struggles to capitalize on the previous day's move higher back closer to the $4,350 level and trades with a mild negative bias during the Asian session on Thursday. The downtick could be attributed to some profit-taking amid a US Dollar uptick, though it is likely to remain cushioned on the back of a supportive fundamental backdrop. 

Dogecoin breaks key support amid declining investor confidence

Dogecoin trades in the red on Thursday, following a 4% decline on the previous day. The DOGE supply in profit declines as large wallet investors trim their portfolios. Derivatives data shows a surge in bearish positions amid declining retail interest.

Monetary policy: Three central banks, three decisions, the same caution

While the Fed eased its monetary policy on 10 December for the third consecutive FOMC meeting, without making any guarantees about future action, the BoE, the ECB and the BoJ are holding their respective meetings this week. 

Dogecoin Price Forecast: DOGE breaks key support amid declining investor confidence

Dogecoin (DOGE) trades in the red on Thursday, following a 4% decline on the previous day. The DOGE supply in profit declines as large wallet investors trim their portfolios. Derivatives data shows a surge in bearish positions amid declining retail interest.