|

AUD/JPY Price Analysis: Trades sideways around 91.70s despite an upbeat mood

  • The AUD/JPY trades sideways, within a busy area surrounded by all the daily Moving Averages.
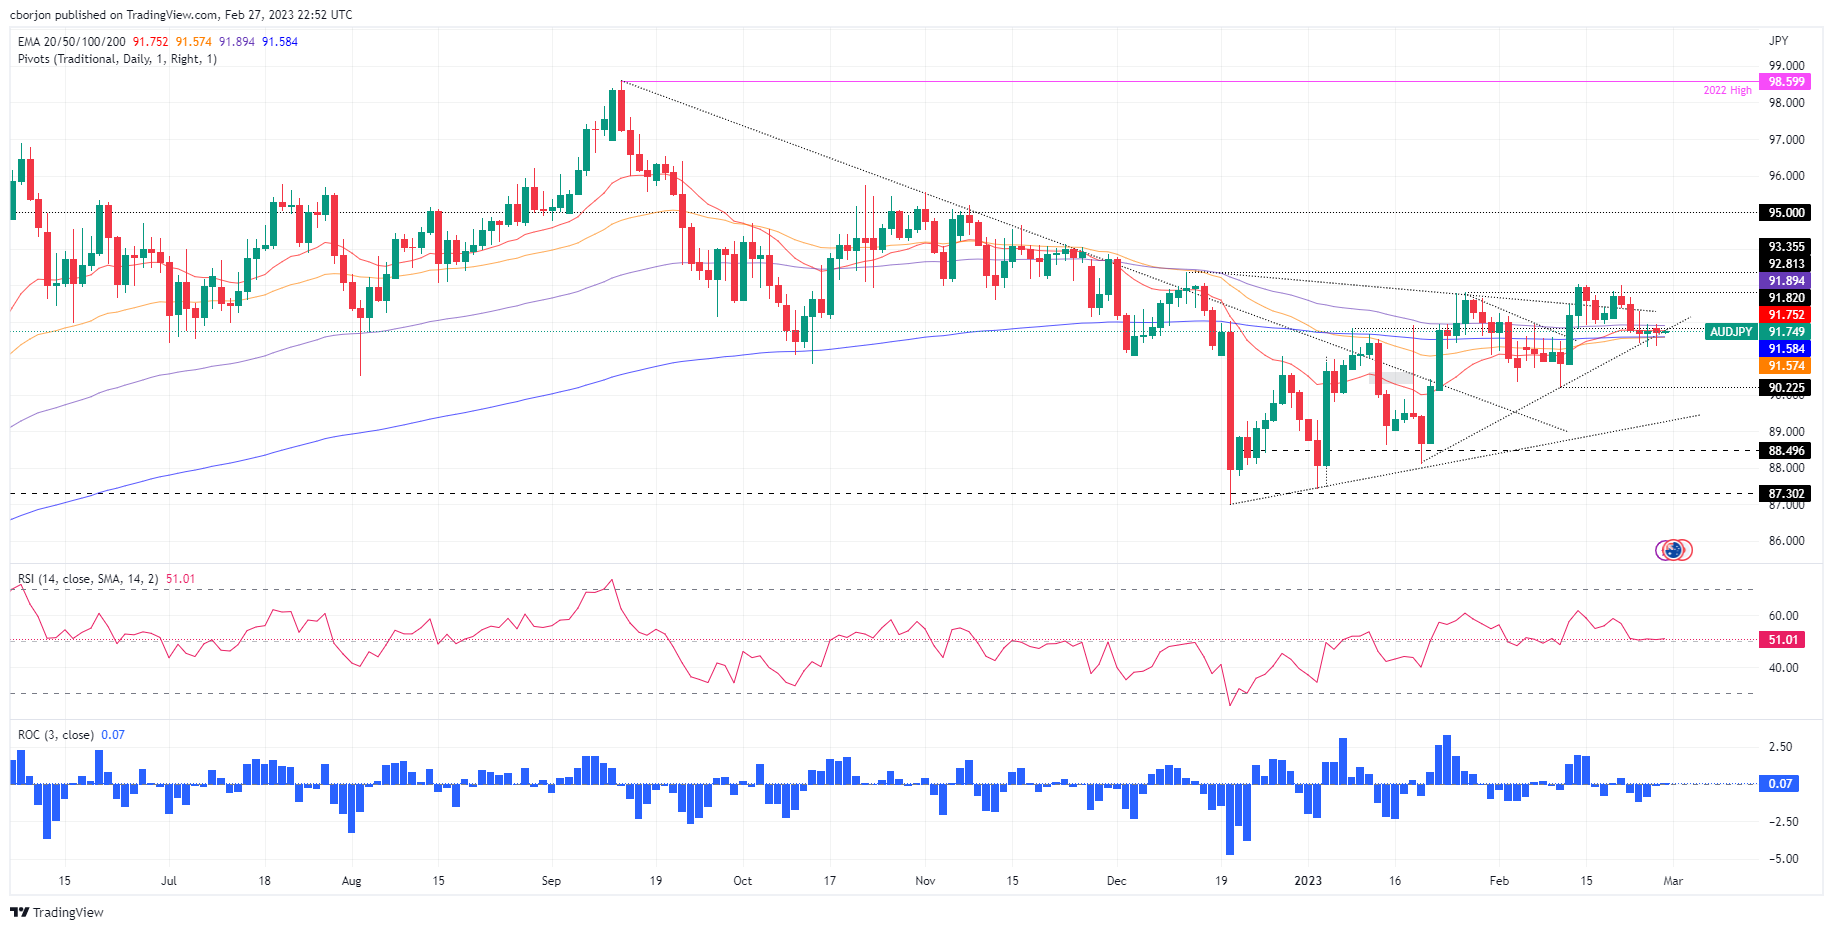
  • AUD/JPY Price Analysis: Range-bound within the 91.57-89 area.

The AUD/JPY fluctuates as the Asian session begins, registering minuscule gains of 0.07%, exchanging hands at around 91.73. A risk-on impulse bolstered the Australian Dollar(AUD), while the Bank of Japan’s (BoJ) newly appointed Governor Kazuo Ueda’s dovish comments were a headwind for the Japanese Yen (JPY).

With the AUD/JPY bottoming around the 91.30 area in the last couple of days, price action is contained within the confluence of all the daily Exponential Moving Averages (EMAs) around the 91.57-89 area. Furthermore, the AUD/JPY is trading sideways as the Relative Strength Index (RSI) shifts flat, meaning buyers and sellers are at equilibrium.

If the AUD/JPY clears the top of the range, the next resistance would be 92.00. A breach of the latter will expose the February 21 high at 93.00, followed by the December 13 high at 93.35. Once reclaimed, the AUD/JPY’s next stop would be the psychological 94.00 barrier.

As an alternate scenario, sellers would exert downward pressure on the pair if the AUD/JPY clears a one-month-old upslope support trendline. The AUD/JPY  first support would be the 91.00 figure. Break below, and the pair would fall toward the February 10 swing low at 90.22 and then the 90.00 psychological level.

AUD/JPY Daily chart

AUD/JPY Key technical levels

AUD/JPY

Overview
Today last price91.77
Today Daily Change0.01
Today Daily Change %0.01
Today daily open91.76
 
Trends
Daily SMA2091.82
Daily SMA5090.83
Daily SMA10092.11
Daily SMA20093.12
 
Levels
Previous Daily High91.94
Previous Daily Low91.31
Previous Weekly High93.01
Previous Weekly Low91.31
Previous Monthly High92.82
Previous Monthly Low87.41
Daily Fibonacci 38.2%91.7
Daily Fibonacci 61.8%91.55
Daily Pivot Point S191.4
Daily Pivot Point S291.04
Daily Pivot Point S390.77
Daily Pivot Point R192.03
Daily Pivot Point R292.3
Daily Pivot Point R392.67

Author

Christian Borjon Valencia

Markets analyst, news editor, and trading instructor with over 14 years of experience across FX, commodities, US equity indices, and global macro markets.

More from Christian Borjon Valencia
Share:

Editor's Picks

EUR/USD holds gains around 1.1800 amid renewed USD selling

EUR/USD regains positive traction and holds around 1.1800 in the European session, reversing the previous day's modest losses. The pair's uptick is sponsored by the emergence of fresh US Dollar selling, which remains induced by persistent trade-related uncertainties. 

GBP/USD strengthens above 1.3500 on softer US Dollar

GBP/USD is posting moderate gains above 1.3500 in European trading on Wednesday. The pair appreciates as the US Dollar meets fresh supply following US President Donald Trump’s first State of the Union address and amid looming tariff uncertainty. 

Gold eyes monthly top above $5,200 amid geopolitics, trade jitters

Gold buyers are back in the game, eyeing $5,200 and beyonf on Wednesday after seeing a correction from monthly highs on Tuesday. The US Dollar slips after Trump’s SOTU fails to impress and as AI-driven worries ease. Dovish Fed bets also weigh.  Gold looks north so long as the key 61.8% Fibo resistance at $5,142 holds on the daily chart.

Bitcoin, Ethereum and Ripple post cautious recovery amid downside risks

Bitcoin, Ethereum, and Ripple are posting a cautious recovery on Wednesday following a market correction earlier this week.  BTC is approaching a key breakdown level, while ETH and XRP are rebounding from crucial support levels.

Nvidia remains at the heart of the AI boom

Nvidia remains at the heart of the AI boom, with Q4 revenue projected near $65.6–66.1 billion, nearly 70% higher year-over-year. But investors are watching cash flow, leverage, and broader AI adoption. Growth is strong, but the AI stress isn’t over.

Cosmos Hub Price Forecast: ATOM rebounds slightly, bearish outlook remains intact

Cosmos Hub (ATOM) price rebounds, trading above $2.05 at the time of writing on Wednesday, after undergoing a sharp correction since last week. Weakening on-chain and derivatives data support a bearish outlook, while technical analysis remains unfavorable.