|

AUD/JPY Price Analysis: Hits 17-year high above 106.00 on JPY weakness

  • AUD/JPY hits a 17-year peak at 106.37, following the BoJ's decision to maintain interest rates.
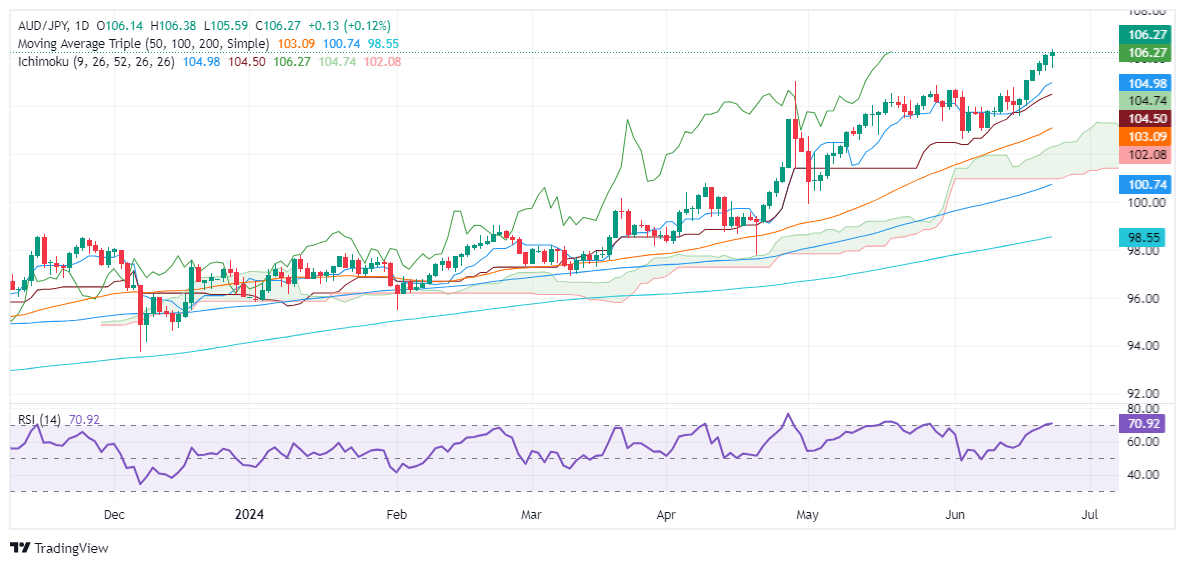
  • Technicals indicate a strong uptrend with RSI in bullish territory; upcoming resistance at 106.50 and 107.00.
  • Support levels include Tenkan-Sen at 104.98, Senkou Span A at 104.73, and Kijun-Sen at 104.49.

The Australian Dollar surged to a new 17-year high of 106.37 against the Japanese Yen as the Bank of Japan failed to increase interest rates on its latest monetary policy decision, which weighed on the Japanese currency. Therefore, the AUD/JPY rallied higher and traded at 106.22, up 0.16%.

AUD/JPY Price Analysis: Technical outlook

The AUD/JPY cross-pair uptrend remains intact, with the pair breaching the previous year-to-date (YTD) high of 104.94, which opened the door to test 105.00 and beyond. Even though momentum favors buyers with the Relative Strength Index (RSI) in bullish territory, downside risks remain due to verbal intervention by Japanese authorities.

If the JPY continued to depreciate steadily, that could pave the way for further gains. The next resistance would be the 106.50, ahead of 107.00. UP next would be the October 2007 peak at 107.86.

Conversely, if the cross-pair extends its losses past 106.00, the first support would be the Tenkan-Sen at 104.98, followed by the Senkou Span A at 104.73. Once cleared, the bull’s last line of defense would be the Kijun-Sen at 104.49.

AUD/JPY Price Action – Daily Chart

AUD/JPY

Overview
Today last price106.26
Today Daily Change0.12
Today Daily Change %0.11
Today daily open106.14
 
Trends
Daily SMA20104.35
Daily SMA50102.95
Daily SMA100100.64
Daily SMA20098.49
 
Levels
Previous Daily High106.16
Previous Daily Low105.47
Previous Weekly High106.16
Previous Weekly Low103.59
Previous Monthly High104.87
Previous Monthly Low99.93
Daily Fibonacci 38.2%105.9
Daily Fibonacci 61.8%105.73
Daily Pivot Point S1105.69
Daily Pivot Point S2105.23
Daily Pivot Point S3105
Daily Pivot Point R1106.38
Daily Pivot Point R2106.62
Daily Pivot Point R3107.07

Author

Christian Borjon Valencia

Markets analyst, news editor, and trading instructor with over 14 years of experience across FX, commodities, US equity indices, and global macro markets.

More from Christian Borjon Valencia
Share:

Editor's Picks

AUD/USD falls to near 0.7100 after slipping below 50-day EMA

AUD/USD depreciates after registering minor gains in the previous day, trading around 0.7120 during the Asian hours. The technical analysis of the daily chart shows the pair consolidating sideways within a rectangle pattern, as neither bulls nor bears gain control. The AUD/USD pair is holding a slight bearish tone however as it sits beneath both the nine-day and 50-day EMAs.

160.00: USD/JPY back near intervention territory after upbeat US jobs report

US Nonfarm Payrolls beat expectations by a wide margin in May, with 172K jobs added. The US Dollar rebounds after the release, helping USD/JPY recover from its intraday lows. Warnings from Japanese authorities continue to limit upside potential near the 160.00 threshold.

Gold targets $4,300 amid stronger Dollar

Gold faces increasing selling interest and navigates the area of three-month lows near the $4,300 mark per troy ounce on Friday. The precious metal’s decline comes as traders assess the stronger-than-expected NFP, while the bid bias in the Greenback and higher US Treasury yields also collaborate with the retracement.

Cardano hits five-year low even as Hoskinson clarifies "break" isn't an exit

Cardano (ADA) price is down 10% at press time on Friday, extending losses over 30% so far this week amid Charles Hoskinson's clarification that "break" isn't an exit.

Week ahead – Fed countdown begins amid US inflation data and geopolitical risks

Fed Chair Warsh’s first meeting approaches as key US inflation data could reshape expectations. Oil prices remain elevated as US-Iran talks continue; tariffs also return to the spotlight. ECB is expected to hike; will it be a one-off move or is July live?

The US economy defies the rules: 100 days into the Oil shock and the recession signal is still missing

More than three months after the start of the Iran war and the resulting disruption to global energy markets, the US economy continues to display remarkable resilience. The conflict has triggered a sharp rise in Oil prices, reignited inflationary pressures and fueled widespread concerns about a potential economic slowdown.