|

AUD/JPY Price Analysis: Heavy losses drag pair near 88.60 as bearish momentum accelerates

  • AUD/JPY plunged near the 88.60 zone on Friday, marking a sharp retreat ahead of the Asian session.
  • MACD confirms a sell signal as the pair faces broad bearish pressure despite neutral oscillators.
  • Key resistance stands at 91.53 and 92.92, while moving averages point to extended downside risk.

The AUD/JPY pair tumbled aggressively on Friday, retreating toward the 88.60 area after shedding over 4% during the day. The move represents one of the steepest intraday declines in recent sessions, dragging the pair away from the recent highs and into a mid-range zone between 87.41 and 92.64. The plunge comes as broader technicals align in favor of sellers, even as some oscillators remain neutral.

Daily chart

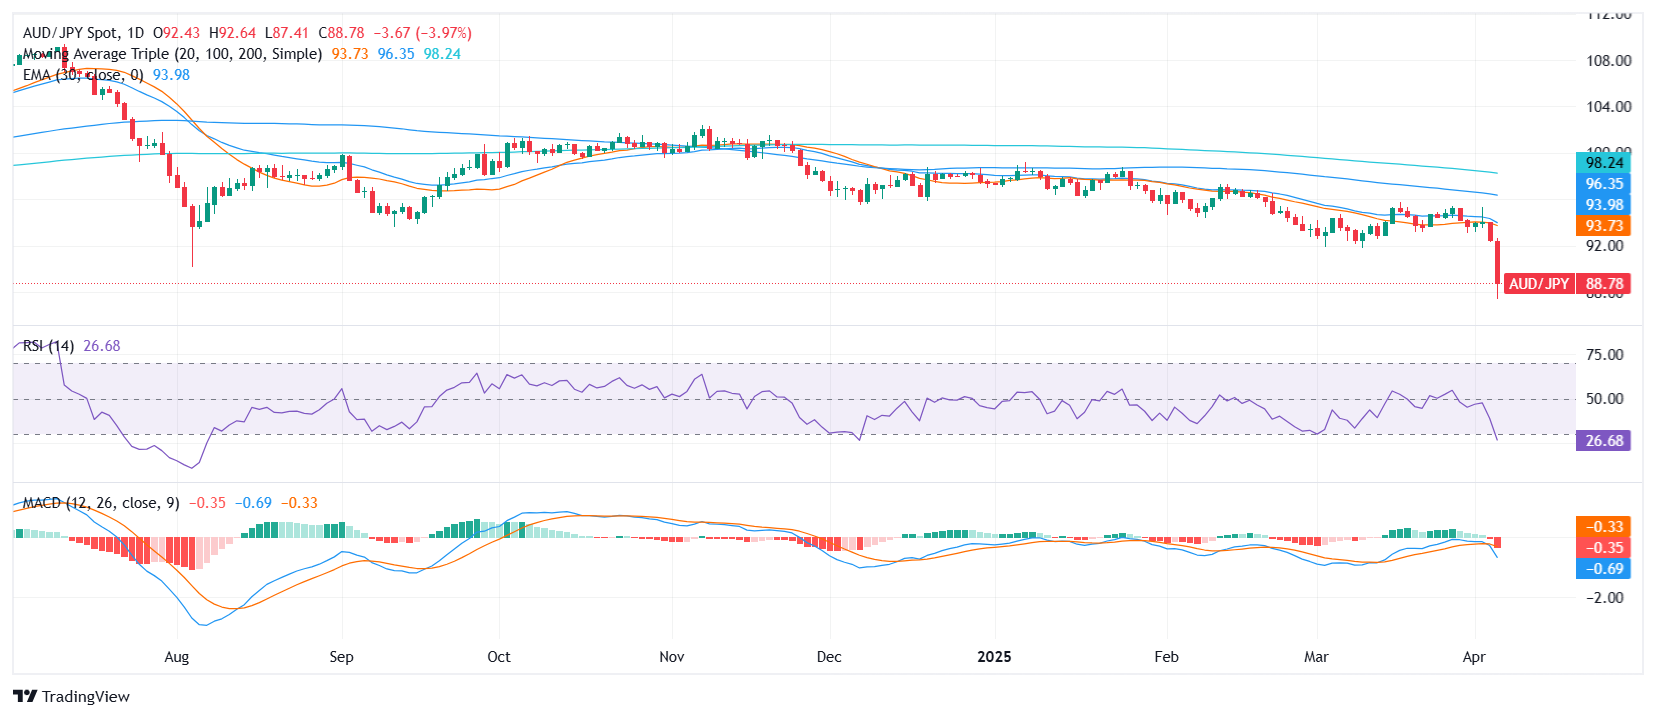
Technical indicators reflect a clearly bearish outlook. The Moving Average Convergence Divergence (MACD) is flashing a strong sell signal, reinforcing downside momentum. Meanwhile, the Relative Strength Index (RSI) sits at 25.56, still neutral but nearing oversold territory. Other momentum measures, such as the Awesome Oscillator (-1.112) and the Ultimate Oscillator (36.03), also remain in neutral zones, suggesting that the momentum may still be building rather than exhausted.

Supportive of the bearish structure, all key moving averages are aligned lower. The 20-day Simple Moving Average (SMA) at 93.72, the 100-day SMA at 96.42, and the 200-day SMA at 98.35 are all reinforcing sustained downside pressure. The 10-day Exponential Moving Average (EMA) and 10-day SMA, both hovering around 92.92–93.61, now act as firm resistance following the latest breakdown.

Author

Patricio Martín

Patricio is an economist from Argentina passionate about global finance and understanding the daily movements of the markets.

More from Patricio Martín
Share:

Editor's Picks

EUR/USD seems fragile below 1.1700 as Middle East war boosts energy prices

The EUR/USD pair trades flat at around 1.1680 during the Asian trading session on Tuesday, but broadly seems vulnerable, being close to its five-week low. The major currency pair is under pressure as surging oil prices due to the United States-Israel war with Iran have increased the risks of higher inflation for the Old Continent.

GBP/USD hovers around 1.3400 with bearish pressure intact

GBP/USD edges higher after three days of losses, trading around 1.3400 during the Asian hours on Tuesday. The technical analysis of the daily chart indicates an ongoing bearish bias, as the pair trades within a descending channel pattern.

Gold stays bullish as Iran war continues to spur safe-haven flows

Gold is finding renewed bids in Asian trades on Tuesday, making another attempt to regain the $5,400 level amid persistent demand for safe-haven assets as the Iran war extends. A softer risk tone remains in play as US President Donald Trump continues to threaten deeper escalation to the ongoing war with Iran, warning that a “big wave” is yet to come.

Top Crypto Gainers: Near Protocol, Virtuals Protocol, and Morpho lead market recovery

Near Protocol, Virtuals Protocol, and Morpho are leading the market recovery with double-digit gains over the last 24 hours. Technically, NEAR extends the breakout of the falling channel pattern, VIRTUAL holds above the 50-day EMA, while MORPHO tests a crucial resistance. 

The market is not panicking it is repricing the probability distribution of Oil and time

At the end of the day, markets do not trade morality or geopolitics. They trade transmission channels. And the only channel that truly matters in this maelstrom runs through the price of energy and the time value of money.

Grass 20% bullish breakout defies broader market weakness

Grass (GRASS) is edging up above $0.30 at the time of writing on Monday. The token’s notable 20% intraday surge stands out amid heightened volatility in the broader crypto market.