|

AUD/JPY Price Analysis: Delivers a triangle breakdown after steady RBA policy

  • AUD/JPY dropped vertically after the RBA announced a steady interest rate decision.
  • Investors expect that the Japanese economy grew by 1.3% in Q2, slower than the growth rate of 1.5% reported for Q1.
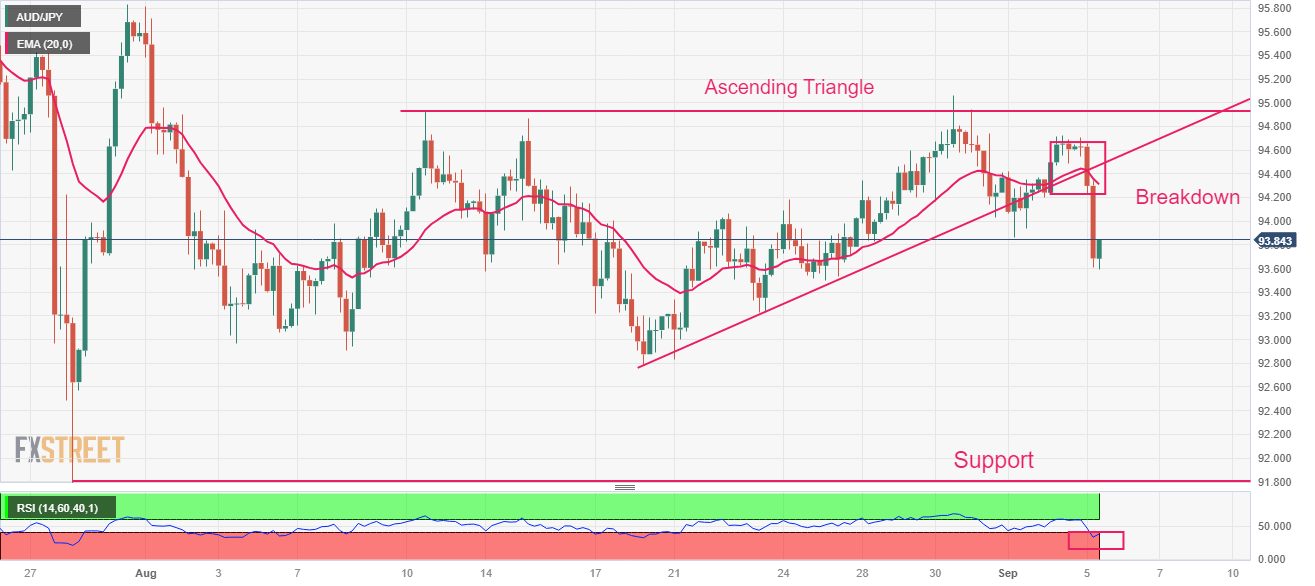
  • AUD/JPY delivers a breakdown of the Ascending Triangle chart pattern, which opens the door for a fresh downside.

The AUD/JPY pair finds an intermediate cushion near 93.60 after a vertical fall inspired by the steady interest rate decision from the Reserve Bank of Australia (RBA). The RBA kept the Official Cash Rate (OCR) unchanged at 4.10% but warned that some further tightening of monetary policy may be required as inflation is still too high and will remain so for some time yet.

Market participants expect that the RBA is done with hiking interest rates as uncertainty over the Chinese economic outlook increases due to faltering prospects.

Meanwhile, the Japanese Yen remains on tenterhooks as investors await the April-June quarter report. As per the estimates, the Japanese economy grew by 1.3%, slower than the growth rate of 1.5% reported for Q1.

AUD/JPY delivers a breakdown of the Ascending Triangle chart pattern formed on a four-hour scale, which opens the door for a fresh downside. For the time being, the asset is expected to remain well-supported above the horizontal support plotted from July 21 low at $91.79. The 20-period Exponential Moving Average (EMA) at $94.30 continues to act as a barricade for the Australian Dollar bulls.

The Relative Strength Index (RSI) (14) skis into the bearish range of 20.00-40.00, which indicates that the bearish momentum has been activated.

Further downside below August 14 low at $93.57 would expose the asset to August 18 low at $92.79 followed by July 21 low at $91.79.

In an alternate scenario, a recovery move above the previous week's high at $95.00 will drive the asset toward July 25 high at $95.86. Breach of the latter would further drive the asset towards July 4 high at $96.83.

AUD/JPY four-hour chart

AUD/JPY

Overview
Today last price93.87
Today Daily Change-0.78
Today Daily Change %-0.82
Today daily open94.65
 
Trends
Daily SMA2094.03
Daily SMA5094.56
Daily SMA10093.37
Daily SMA20091.93
 
Levels
Previous Daily High94.72
Previous Daily Low94.2
Previous Weekly High95.06
Previous Weekly Low93.78
Previous Monthly High95.81
Previous Monthly Low92.79
Daily Fibonacci 38.2%94.52
Daily Fibonacci 61.8%94.4
Daily Pivot Point S194.32
Daily Pivot Point S294
Daily Pivot Point S393.8
Daily Pivot Point R194.85
Daily Pivot Point R295.05
Daily Pivot Point R395.37

Author

Sagar Dua

Sagar Dua

FXStreet

Sagar Dua is associated with the financial markets from his college days. Along with pursuing post-graduation in Commerce in 2014, he started his markets training with chart analysis.

More from Sagar Dua
Share:

Markets move fast. We move first.

Orange Juice Newsletter brings you expert driven insights - not headlines. Every day on your inbox.

By subscribing you agree to our Terms and conditions.

Editor's Picks

EUR/USD clings to small gains near 1.1750

Following a short-lasting correction in the early European session, EUR/USD regains its traction and clings to moderate gains at around 1.1750 on Monday. Nevertheless, the pair's volatility remains low, with investors awaiting this weeks key data releases from the US and the ECB policy announcements.

GBP/USD edges higher toward 1.3400 ahead of US data and BoE

GBP/USD reverses its direction and advances toward 1.3400 following a drop to the 1.3350 area earlier in the day. The US Dollar struggles to gather recovery momentum as markets await Tuesday's Nonfarm Payrolls data, while the Pound Sterling holds steady ahead of the BoE policy announcements later in the week.

Gold stuck around $4,300 as markets turn cautious

Gold loses its bullish momentum and retreats below $4,350 after testing this level earlier on Monday. XAU/USD, however, stays in positive territory as the US Dollar remains on the back foot on growing expectations for a dovish Fed policy outlook next year.

Solana consolidates as spot ETF inflows near $1 billion signal institutional dip-buying

Solana price hovers above $131 at the time of writing on Monday, nearing the upper boundary of a falling wedge pattern, awaiting a decisive breakout. On the institutional side, demand for spot Solana Exchange-Traded Funds remained firm, pushing total assets under management to nearly $1 billion since launch. 

Big week ends with big doubts

The S&P 500 continued to push higher yesterday as the US 2-year yield wavered around the 3.50% mark following a Federal Reserve (Fed) rate cut earlier this week that was ultimately perceived as not that hawkish after all. The cut is especially boosting the non-tech pockets of the market.

Solana Price Forecast: SOL consolidates as spot ETF inflows near $1 billion signal institutional dip-buying

Solana (SOL) price hovers above $131 at the time of writing on Monday, nearing the upper boundary of a falling wedge pattern, awaiting a decisive breakout.

AUD/JPY Price Analysis: Delivers a triangle breakdown after steady RBA policy