|

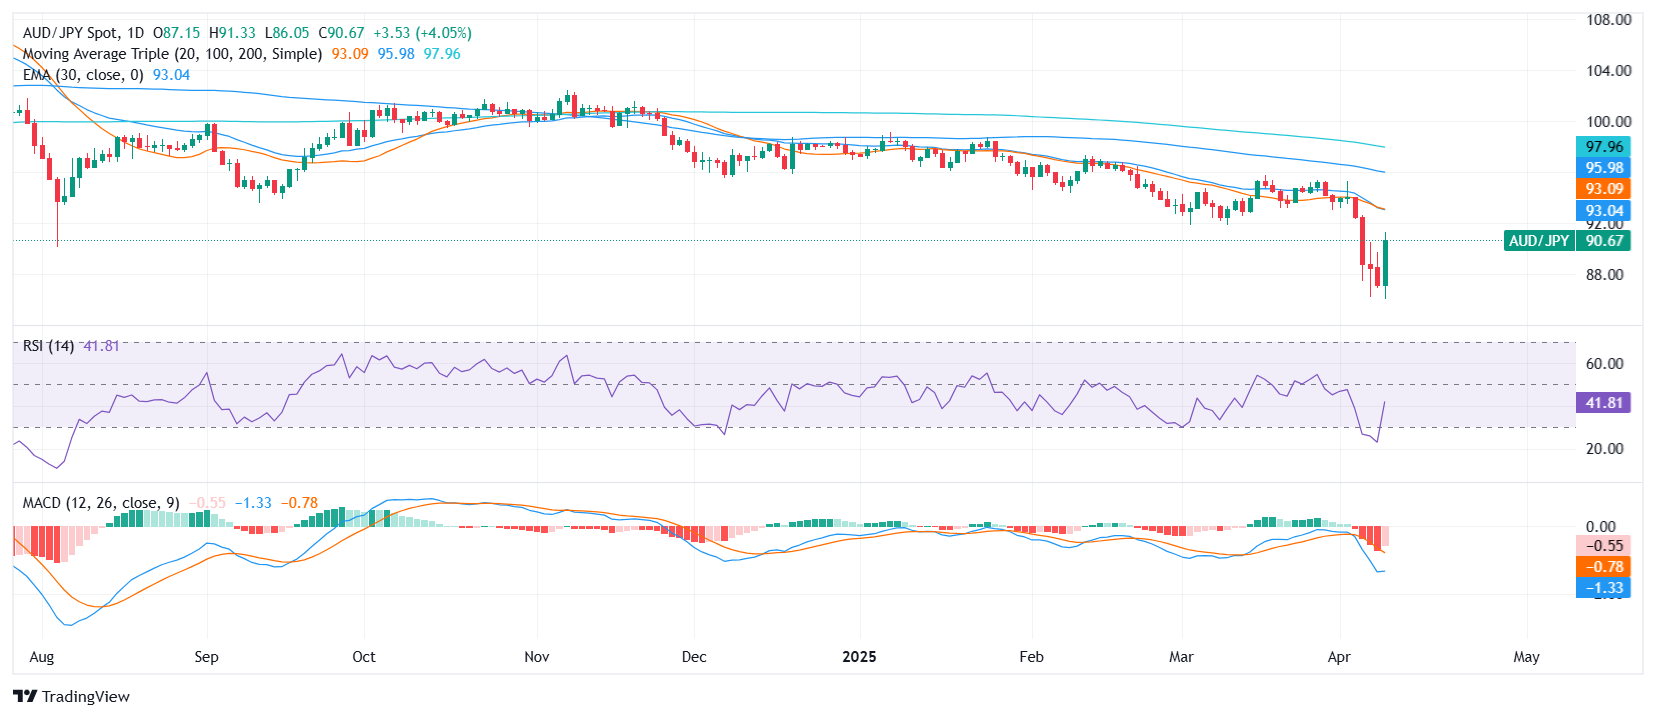
AUD/JPY Price Analysis: Cross jumps sharply but bearish signals persist

  • AUD/JPY surged, seen trading near the 91.00 zone after a strong intraday rally
  • Despite the bullish move, key indicators still suggest an overall bearish technical backdrop
  • Short-term resistance is seen near 91.20 and 91.90, with support holding around 90.90 and 87.30

The AUD/JPY pair staged a sharp rebound on Wednesday’s session ahead of the Asian open, climbing toward the 91.00 area after rising more than 4% during the day. Despite the aggressive intraday bounce, technical indicators and moving averages continue to flash bearish signals, hinting at lingering downside risk even as short-term momentum turns positive.

The pair is currently trading near the upper boundary of the day’s range, which spanned from 86.05 to 91.27, suggesting strong bullish pressure. However, several technical readings temper the optimism. The Relative Strength Index (RSI) stands at 42.71, still within neutral territory, while the Moving Average Convergence Divergence (MACD) issues a sell signal. Stochastic %K (14, 3, 3) at 29.69 and the Ultimate Oscillator at 48.82 both reflect neutral momentum.

Moving averages reinforce the broader bearish narrative. The 20-day Simple Moving Average (SMA) at 93.11, 100-day SMA at 96.08, and 200-day SMA at 98.08 all slope downward. Additionally, the 10-day Exponential Moving Average (EMA) at 91.19 and the 10-day SMA at 91.89 are positioned above current price levels, acting as immediate resistance zones.

Daily chart

Author

Patricio Martín

Patricio is an economist from Argentina passionate about global finance and understanding the daily movements of the markets.

More from Patricio Martín
Share:

Markets move fast. We move first.

Orange Juice Newsletter brings you expert driven insights - not headlines. Every day on your inbox.

By subscribing you agree to our Terms and conditions.

Editor's Picks

EUR/USD bounces toward 1.1750 as US Dollar loses strength

EUR/USD returned to the 1.1750 price zone in the American session on Friday, despite falling Wall Street, which indicates risk aversion. Trading conditions remain thin following the New Year holiday and ahead of the weekend, with the focus shifting to US employment and European data scheduled for next week.

GBP/USD nears 1.3500, holds within familiar levels

After testing 1.3400 on the last day of 2025, GBP/USD managed to stage a rebound. Nevertheless, the pair finds it difficult to gather momentum and trades with modest intraday gains at around 1.3490 as market participants remain in holiday mood.

Gold trims intraday gains, approaches $4,300

Gold retreated sharply from the $4,400  area and trades flat for the day in the $4,320 price zone. Choppy trading conditions exacerbated the intraday decline, although XAU/USD bearish case is out of the picture, considering growing expectations for a dovish Fed and persistent geopolitical tensions.

Cardano gains early New Year momentum, bulls target falling wedge breakout

Cardano kicks off the New Year on a positive note and is extending gains, trading above $0.36 at the time of writing on Friday. Improving on-chain and derivatives data point to growing bullish interest, while the technical outlook keeps an upside breakout in focus.

Economic outlook 2026-2027 in advanced countries: Solidity test

After a year marked by global economic resilience and ending on a note of optimism, 2026 looks promising and could be a year of solid economic performance. In our baseline scenario, we expect most of the supportive factors at work in 2025 to continue to play a role in 2026.

Crypto market outlook for 2026

Year 2025 was volatile, as crypto often is.  Among positive catalysts were favourable regulatory changes in the U.S., rise of Digital Asset Treasuries (DAT), adoption of AI and tokenization of Real-World-Assets (RWA).