|

AUD/JPY Price Analysis: Conquers the 50-day EMA, reclaims 95.00 on upbeat mood

  • AUD/JPY has climbed for two-straight days after the Bank of Japan (BoJ) intervention and is up by 0.87% in the week.
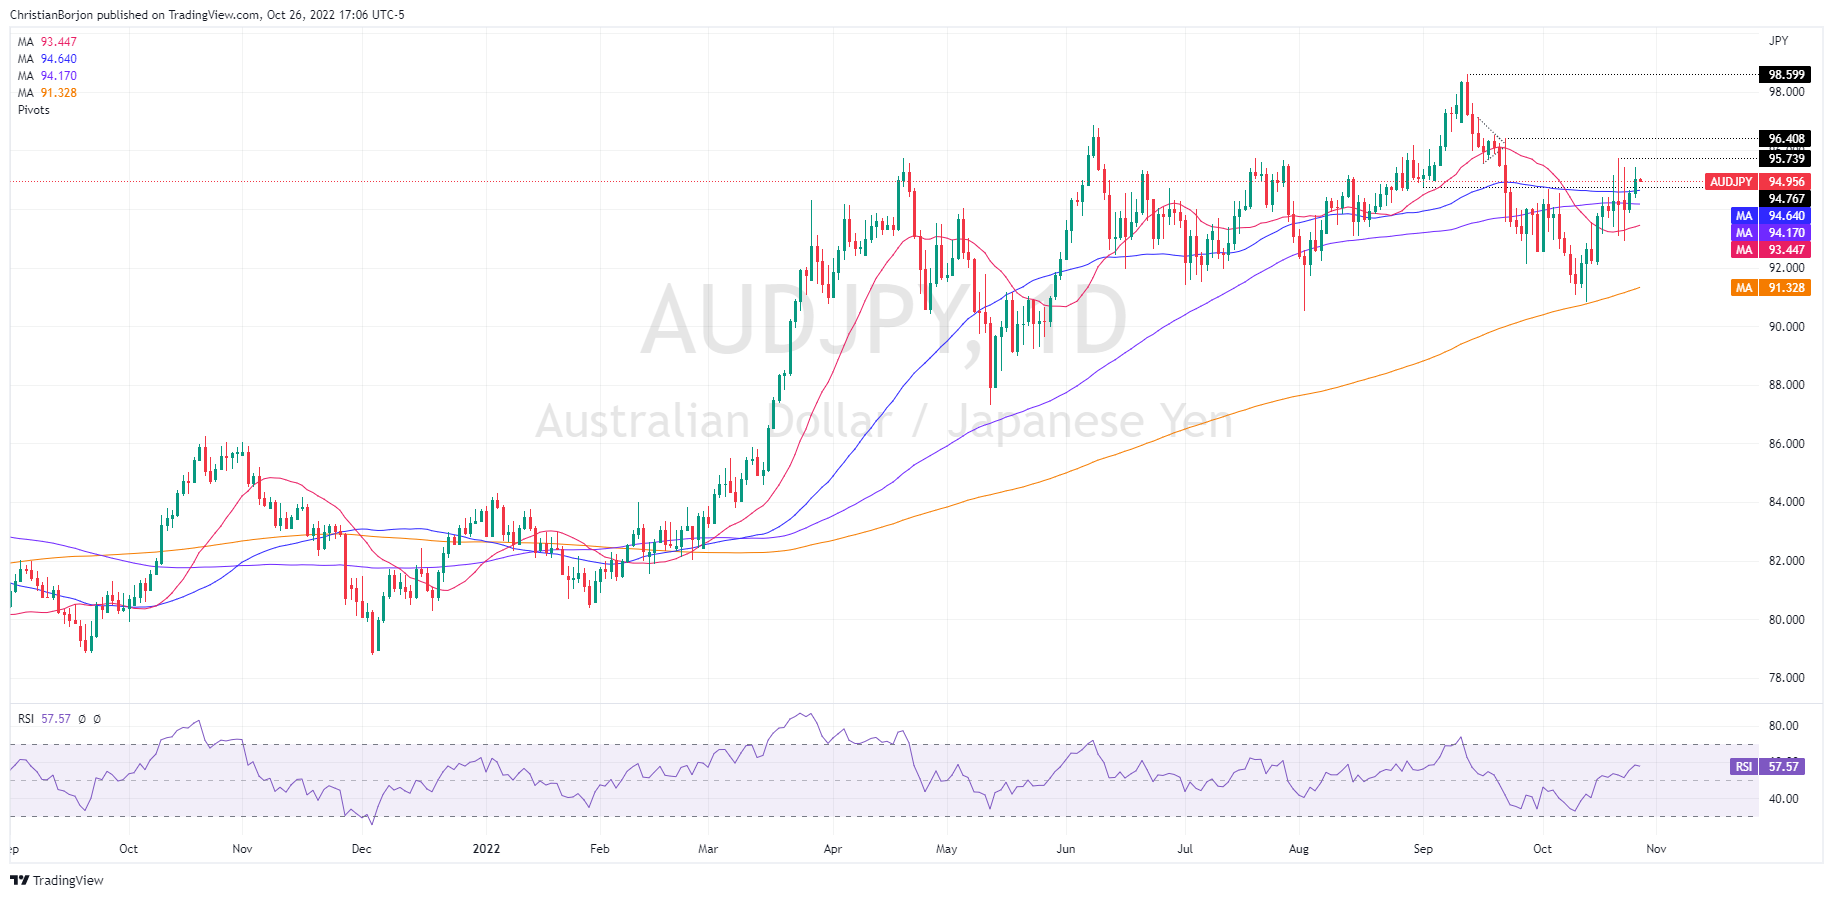
  • The AUD/JPY daily chart is upward-biased, and if it clears 95.44, a retest of 96.40 is on the cards, ahead f the YTD high at 98.60.

The AUD/JPY rebounded at the 50-day Exponential Moving Average (EMA) and rose to Wednesday’s daily high at 95.44 before trimming some gains. However, the cross-currency finished the day with a half-percentage point gain. As the Thursday Asian Pacific session begins, the AUD/JPY is trading at 95.03, flat.

AUD/JPY Price Analysis: Technical outlook

The AUD/JPY daily chart delineates the pair trading upwards, as the upward bias remains intact. Worth noticing that on its way toward 95.00, the cross-currency pair cleared the 50-day EMA, shifting the bias from neutral-upwards to upwards, opening the door for further gains. Also, the Relative Strength Index (RSI) is in bullish territory, and the slope turned flat, meaning that the AUD/JPY might consolidate before resuming the ongoing uptrend.

Upwards, the AUD/JPY’s first resistance would be October’s 26 daily high at 95.44, followed by the 96.00 figure, and the September 22 daily high at 96.40. Conversely, the AUD/JPY’s first support would be the 50-day EMA at 94.64. A breach of the latter will send the cross sliding towards the 100-day EMA at 94.17, followed by the 20-day EMA at 93.45.

AUD/JPY Key Technical Levels

AUD/JPY

Overview
Today last price95.04
Today Daily Change0.43
Today Daily Change %0.45
Today daily open94.61
 
Trends
Daily SMA2093.36
Daily SMA5094.62
Daily SMA10094.22
Daily SMA20091.24
 
Levels
Previous Daily High94.67
Previous Daily Low93.87
Previous Weekly High95.75
Previous Weekly Low92.13
Previous Monthly High98.58
Previous Monthly Low92.13
Daily Fibonacci 38.2%94.36
Daily Fibonacci 61.8%94.18
Daily Pivot Point S194.1
Daily Pivot Point S293.58
Daily Pivot Point S393.29
Daily Pivot Point R194.9
Daily Pivot Point R295.19
Daily Pivot Point R395.7

Author

Christian Borjon Valencia

Christian Borjon began his career as a retail trader in 2010, mainly focused on technical analysis and strategies around it. He started as a swing trader, as he used to work in another industry unrelated to the financial markets.

More from Christian Borjon Valencia
Share:

Markets move fast. We move first.

Orange Juice Newsletter brings you expert driven insights - not headlines. Every day on your inbox.

By subscribing you agree to our Terms and conditions.

Editor's Picks

EUR/USD runs past 1.1730 after tepid US macroeconomic figures

EUR/USD extends its gains and trades above 1.1730 in the American session on Thursday. The US Dollar resumed its decline, following much weaker-than-expected Initial Jobless Claims. Market players bet for additional rate cuts despite a mildly hawkish Fed.

GBP/USD ticks north beyond 1.3400 after US employment data

GBP/USD ticks beyond 1.3400 in the American session on Thursday, as the US Dollar is back on the losing side, following worse-than-anticipated US employment-related figures. The US Federal Reserve delivered a rate cut at its December meeting, in line with the market’s expectations.

Gold on its way to retest record highs

Broad US Dollar weakness helps the bright metal to extend weekly gains. The XAU/USD pair trades above $4,250, its highest for the week and not far from its record high in the $4,380 region. The Greenback came under selling pressure on Wednesday following the Federal Reserve's monetary policy announcement, further pressured on Thursday by softer-than-anticipated United States employment data. 

Solana dips as hawkish Fed cuts dampen market sentiment

Solana price is trading below $130 on Thursday, after being rejected at the upper boundary of its falling wedge pattern. The broader market weakness following the Federal Reserve’s hawkish rate cut has added to downside momentum.

FOMC Summary: A split cut and a clear shift toward caution

The Federal Reserve (Fed) went ahead with a 25 basis points rate cut, taking the target range to 3.50–3.75%. But the tone around the decision mattered just as much as the move.

Solana dips as hawkish Fed cuts dampen market sentiment
Solana (SOL) price is trading below $130 at the time of writing on Thursday, after being rejected at the upper boundary of its falling wedge pattern. The broader market weakness following the Federal Reserve’s hawkish rate cut has added to downside momentum.