|

AUD/JPY Price Analysis: About to confirm Head-and-Shoulders, 74.50 in focus

  • AUD/JPY extends declines from 75.62 while portraying a bearish chart pattern.
  • A three-week-old rising support line adds to the downside barriers.
  • Multiple high above 76.50, bearish MACD keep the sellers hopeful.

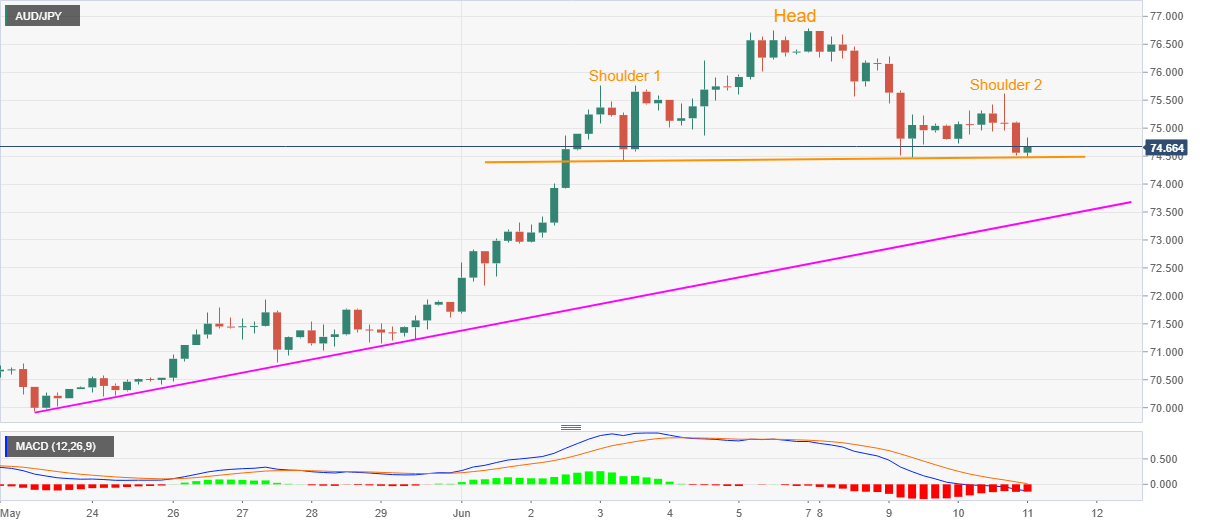
AUD/JPY drops to 74.60, down 0.47% on a day, during the early Thursday. In doing so, the pair rests near the neckline of a short-term Head-and-Shoulders bearish formation on the 4-hour chart.

Other than the chart pattern, bearish MACD also favors the sellers. However, the bears need a clear break below 74.50 to justify the ability to target theoretically expected fall towards 72.20.

During the pair’s declines between 74.50 and 72.20, an ascending trend line from May 22, at 73.30 now, might offer an intermediate halt. Though, any more downside past-72.20 might not hesitate to visit May 27 top near 71.90.

On the upside, 75.60 and 76.00 might offer nearby resistance to the pair, a break of which could question the bearish chart pattern while aiming a break of 76.80.

It should, however, be noted that multiple highs marked during late-2019 and the early-2020 around 76.50 might question the bulls.

AUD/JPY four-hour chart

Trend: Further downside expected

Additional important levels

Overview
Today last price74.64
Today Daily Change-0.33
Today Daily Change %-0.44%
Today daily open74.97
 
Trends
Daily SMA2072.44
Daily SMA5070.02
Daily SMA10070.21
Daily SMA20072.28
 
Levels
Previous Daily High75.62
Previous Daily Low74.72
Previous Weekly High76.75
Previous Weekly Low71.61
Previous Monthly High71.93
Previous Monthly Low67.63
Daily Fibonacci 38.2%75.07
Daily Fibonacci 61.8%75.28
Daily Pivot Point S174.59
Daily Pivot Point S274.21
Daily Pivot Point S373.7
Daily Pivot Point R175.48
Daily Pivot Point R276
Daily Pivot Point R376.37

Author

Anil Panchal

Anil Panchal

FXStreet

Anil Panchal has nearly 15 years of experience in tracking financial markets. With a keen interest in macroeconomics, Anil aptly tracks global news/updates and stays well-informed about the global financial moves and their implications.

More from Anil Panchal
Share:

Editor's Picks

EUR/USD flirts with weekly lows near 1.1770

EUR/USD now comes under further selling pressure, breaking below the 1.1800 support to challenge the area of weekly throughs near 1.1770 on Thursday. The pair’s decline comes in response to marked gains in the US Dollar amid steady geopolitical tensions. Ealier in the day, the ECB’s Lagarde delivered cautious remarks, although the currency remained apathetic.

GBP/USD threatens the 200-day SMA near 1.3440

GBP/USD rapidly leaves behind Wednesday’s strong advance, coming under heavy pressure and retesting the 1.3440 zone, where the critical 200-day SMA is located. Cable’s deep pullback follows the strong gains in the Greenback, while investors continue to pencil in a potential BoE rate cut in March.

Gold trims gains, slips back to around $5,170

Gold is now facing some downside pressure, hovering around the $5,170 region on Thursday. The yellow metal surrenders part of its earlier gains on the back of the resurgence of the buying interest in the Greenback. In the meantime, geopolitical tensions in the Middle East continue to limit the downside potential for now.

Stellar: Relief bounce fades as bearish undertone persists

Stellar is trading around $0.16 at the time of writing on Thursday after rebounding more than 8% in the previous day. Derivatives data paints a negative picture as XLM’s short bets hit a monthly high while Open Interest continues to decline.

Changing the game: International implications of recent tariff developments

The Supreme Court ruling on International Emergency Economic Powers Act (IEEPA) tariffs provides limited relief for the rest of the world, with weighted average tariff rates modestly lower.

Bitcoin steadies as traders eye US–Iran talks

Bitcoin (BTC) price is stabilizing around $68,000 at the time of writing on Thursday after a 6.2% relief rally the previous day amid a broader downward trend.