ASX Elliott Wave technical analysis [Video]
![ASX Elliott Wave technical analysis [Video]](https://editorial.fxstreet.com/images/TechnicalAnalysis/ChartPatterns/Chartism/mobile-phone-with-stock-chart-62799468.jpg)
ASX: ASX LIMITED – ASX Elliott Elliott Wave Technical Analysis TradingLounge.
Greetings, Our Elliott Wave analysis today updates the Australian Stock Exchange (ASX) ASX LIMITED – ASX. We see ASX LIMITED possibly pushing lower with wave ((ii))-navy, and then wave ((iii))-navy could move higher.
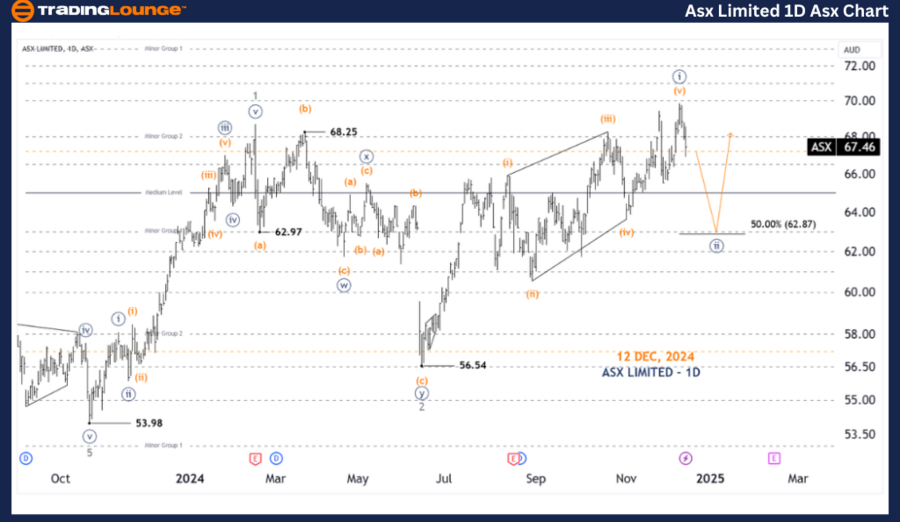
ASX one day chart (semilog scale) analysis
Function: Major (Minor degree, gray).
Mode: Motive.
Structure: Impulse.
Position: Wave ((ii))-navy of Wave 3-grey.
Details: Wave ((ii))-navy could be pushing lower, targeting around 62.87. After the ((ii))-navy wave finds support levels at lower levels, then most likely the ((iii))-navy wave will return soon. And they can go long when the price gets the support tested at Medium Level 65.00.
Invalidation point: 56.54.
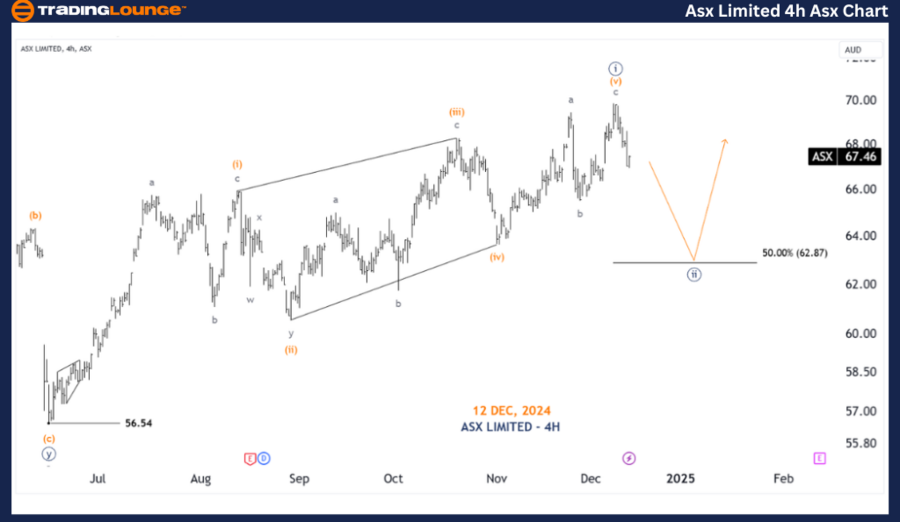
ASX four-hour chart analysis
Function: Major trend (Minor degree, grey).
Mode: Motive.
Structure: Impulse.
Position: Wave ((ii))-navy of Wave 3-grey.
Details: Wave ((i))-navy has completed five waves, and wave ((ii))-navy is moving lower, usually after Diagonals, I expect a quick serious decline, so the next target could be around 62.87.
Invalidation point: 56.54.
Conclusion:
Our analysis, forecast of contextual trends, and short-term outlook for ASX: ASX LIMITED – ASX aim to provide readers with insights into the current market trends and how to capitalize on them effectively. We offer specific price points that act as validation or invalidation signals for our wave count, enhancing the confidence in our perspective. By combining these factors, we strive to offer readers the most objective and professional perspective on market trends.
Technical analyst: Hua (Shane) Cuong, CEWA-M (Master’s Designation).
ASX four-hour chart analysis [Video]
Author

Peter Mathers
TradingLounge
Peter Mathers started actively trading in 1982. He began his career at Hoei and Shoin, a Japanese futures trading company.


