Asian Paints Elliott Wave technical analysis [Video]
![Asian Paints Elliott Wave technical analysis [Video]](https://editorial.fxstreet.com/images/TechnicalAnalysis/ChartPatterns/Candlesticks/stock-market-graph-and-bar-chart-price-display-75053099_XtraLarge.jpg)
Asian Paints Elliott Wave technical analysis
-
Function: Larger Degree Trend (Higher - Intermediate Degree, Orange).
-
Mode: Motive.
-
Structure: Potential Impulse.
-
Position: Minute Wave ((ii)) Navy.
-
Details: The current structure suggests that Intermediate Wave (5) Orange may be progressing higher. Wave (4) Orange seems to have ended as a larger degree triangle around the 2600-50 zone. Additionally, Minor Waves 1 and 2 of (5) are complete, and Minor Wave 3 is now in progress. Minute Wave ((ii)) Navy of Minor Wave 3 may have completed around the 3000 level. If correct, Minute Wave ((iii)) may soon begin. Alternatively, if Intermediate Wave (5) Orange terminated around 3570, a larger degree correction could be unfolding.
-
Invalidation Point: 2840.
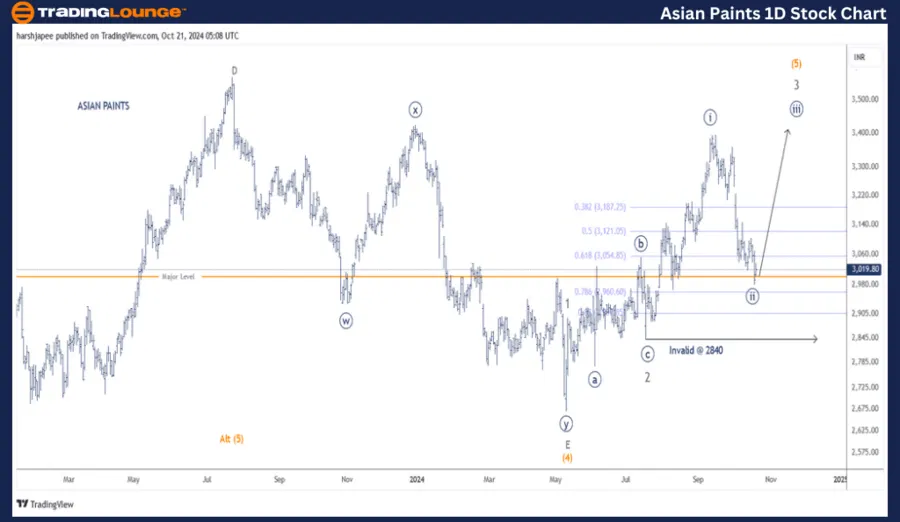
Asian Paints daily chart technical analysis and potential Elliott Wave counts
The daily chart for ASIAN PAINTS indicates that Intermediate Wave (5) Orange is moving higher after Intermediate Wave (4) concluded around 2670. The stock found support around 2980 and is trading near the 3040 mark at the time of writing.
Previously, a larger degree triangle consolidation occurred between October 2021 and May 2024, which ended Intermediate Wave (4) Orange around the 2670 lows. Since then, Minor Waves 1 and 2 Grey have completed, and Minor Wave 3 is extending higher.
If the current wave structure remains intact, prices are expected to hold above 2840, the termination level of Minute Wave ((ii)) of 3, as bulls push towards the 3400 level going forward.
Asian Paints Elliott Wave technical analysis
-
Function: Larger Degree Trend (Higher - Intermediate Degree, Orange).
-
Mode: Motive.
-
Structure: Potential Impulse.
-
Position: Minute Wave ((ii)) Navy.
-
Details: The current structure implies that Intermediate Wave (5) Orange is likely progressing higher. Wave (4) Orange seems to have completed as a larger degree triangle around the 2600-50 zone. Minor Waves 1 and 2 are now complete as Minor Wave 3 progresses. Minute Wave ((ii)) Navy of Minor Wave 3 appears to have completed around 3000. If accurate, Minute Wave ((iii)) should soon be in progress. Alternatively, if Intermediate Wave (5) Orange ended near 3570, a larger correction may be in progress. The stock appears to be bouncing off the 0.618 Fibonacci support level at the time of writing.
-
Invalidation point: 2840.
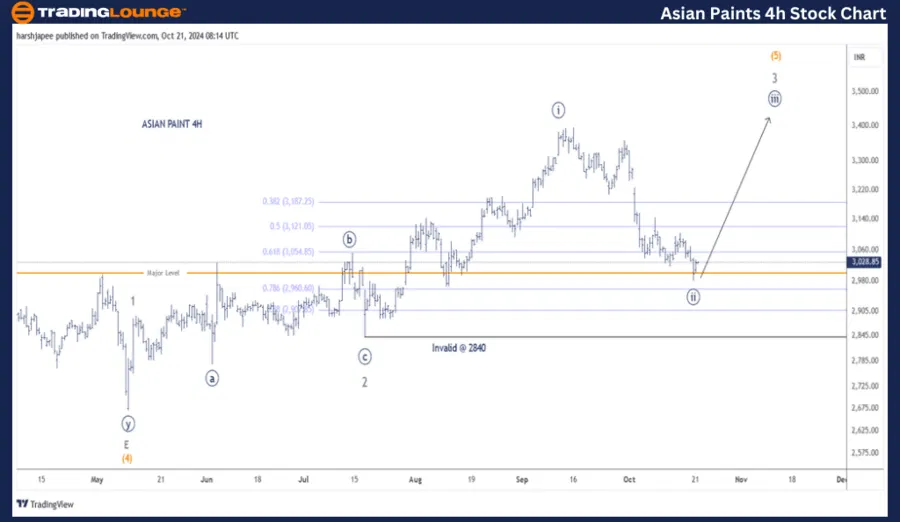
Asian Paints four-hour chart technical analysis and potential Elliott Wave counts
The 4H chart for ASIAN PAINTS highlights sub-waves within Intermediate Wave (5) Orange, after a triangle termination around 2670. Minor Waves 1 and 2 were completed around the 2890 and 2840 levels respectively. Minor Wave 3 seems to be extending, with Minute Wave ((i)) forming around 3400, followed by Minute Wave ((ii)) around 2980. If correct, Minute Wave ((iii)) should begin shortly.
Conclusion
ASIAN PAINTS may be progressing higher in Minute Wave ((iii)) Navy, within Minor Wave 3 Grey of Intermediate Wave (5) Orange, with support at 2840.
Asian Paints Elliott Wave technical analysis [Video]
Author

Peter Mathers
TradingLounge
Peter Mathers started actively trading in 1982. He began his career at Hoei and Shoin, a Japanese futures trading company.


